
As reported on November 13, 2026, Maple Finance’s third-quarter revenue illustrates a distinction between growth in lending activity and growth in revenue earned per dollar deposited. In an analysis using Maple Transparency data, Maple loan events and on-chain balances, Alea Research attributed most of the June-to-September revenue increase to a higher management fee on syrupUSDC, even as total deposits declined.
The fee change behind the buyback threshold
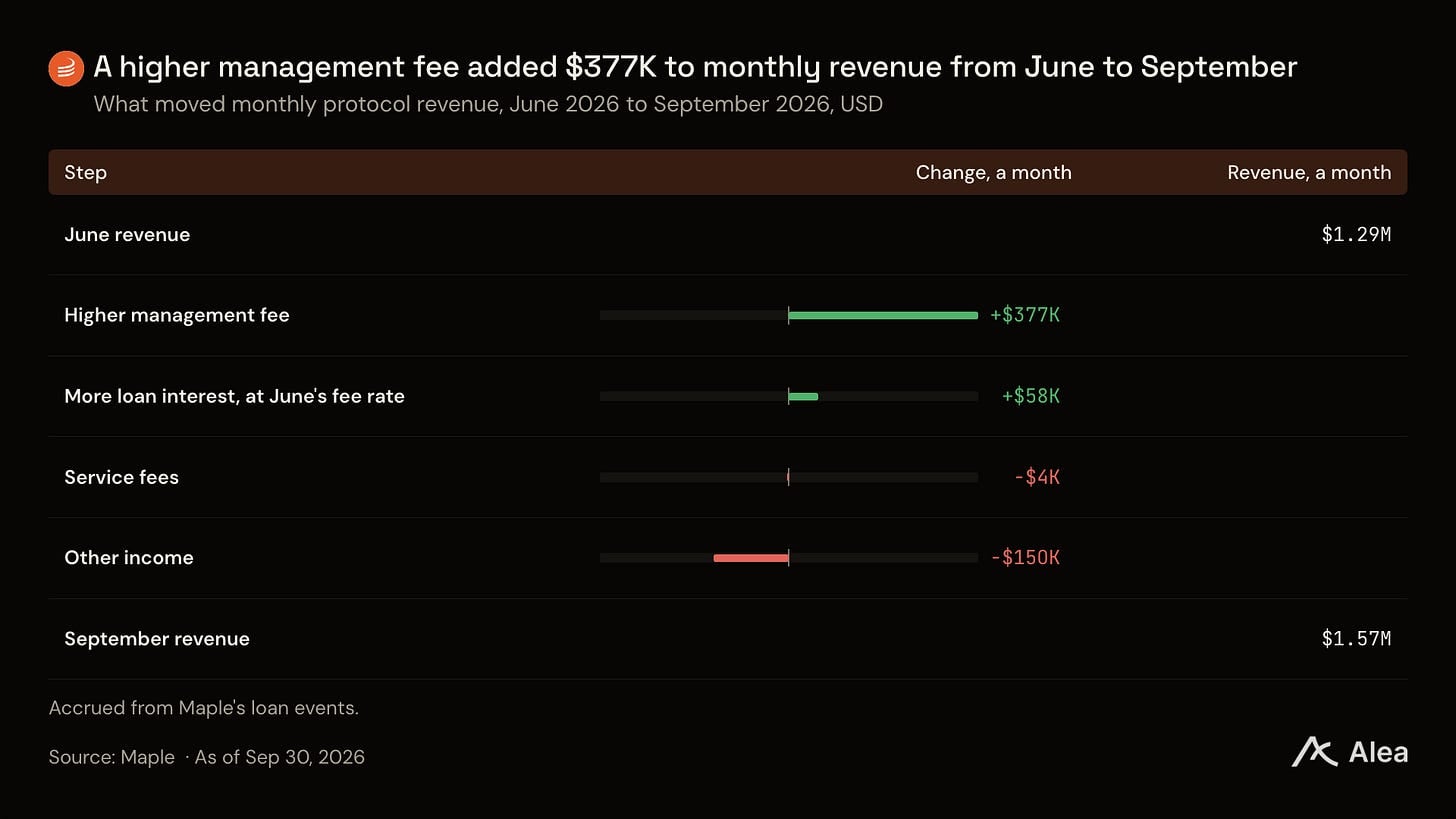
Beginning in August, as loans entered their next interest-payment periods, Maple increased the syrupUSDC management fee from approximately 8 cents to 15 cents per dollar of interest. Depositors bore the difference. Alea Research estimated that the fee change added $377,000 to monthly revenue between June and September, compared with $58,000 from increased loan interest.
September revenue reached $1.57 million. At June’s fee rate, Alea Research estimated it would instead have been about $1.19 million—below the $1.5 million threshold for the middle buyback tier under MIP-021, the buyback rules introduced in July. Third-quarter revenue totaled $4.41 million, versus $4.38 million in the second quarter. Borrower loan fees accounted for 82% of third-quarter revenue, up from 33% in the first quarter.
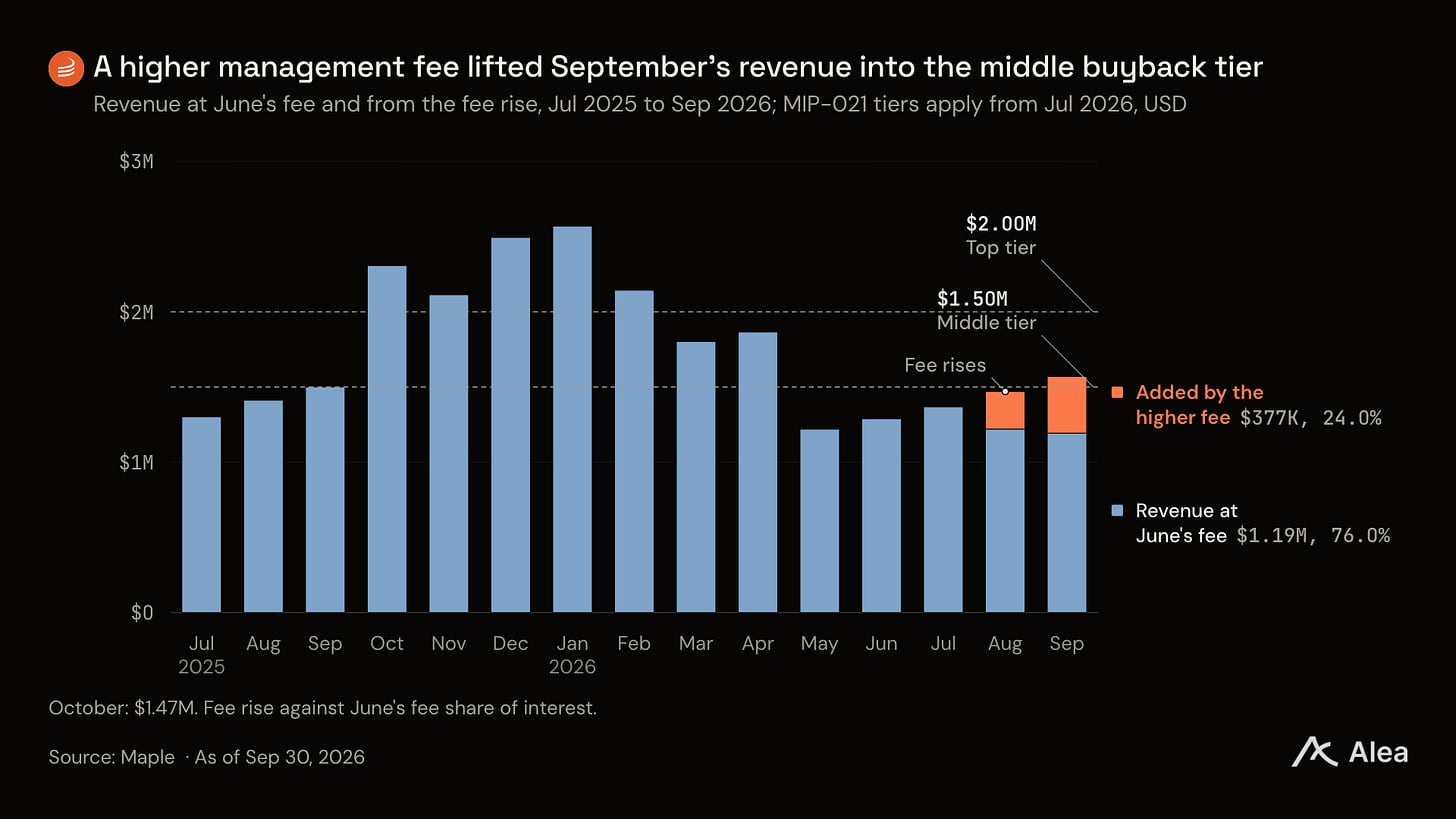
October revenue then fell to $1.47 million, returning the buyback rate to 10%, or approximately $147,000 for that month. Across the third quarter, buybacks used 13.6% of revenue and acquired 2.9 million SYRUP for the Syrup Strategic Fund. The comparable revenue shares were 3.4% in the first half of 2026 and 25% in the third quarter of 2025.
Deposits shifted across holders and venues
Maple lends stablecoins to institutions against crypto collateral, primarily BTC, while underwriting each borrower itself. Its outstanding loans were $1.67 billion on September 30, making it the fourth-largest on-chain lending protocol by that measure in Alea Research’s comparison. Loans had grown 2.7% since December 31, 2025, while the top ten protocols collectively declined 15% over that period. In the third quarter alone, however, the top ten grew 32% while Maple contracted.
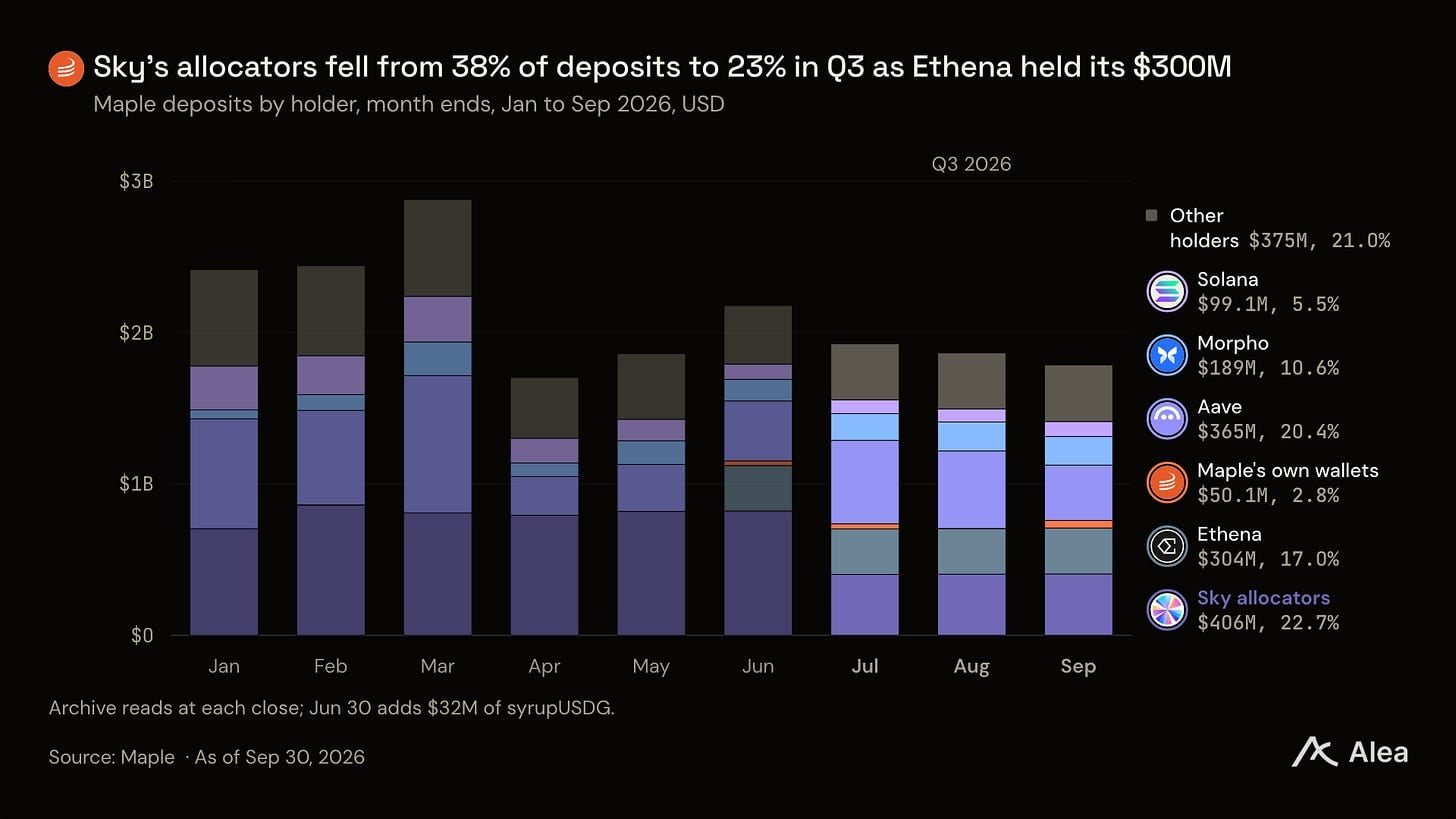
Total deposits fell 17% during the quarter. Two Sky allocators withdrew approximately $422 million; their combined holdings declined from $822 million on June 30 to $406 million on September 30. Leveraged syrupUSDT positions also left Plasma, contributing to a $330 million decline in syrupUSDT on other chains. One wallet moved approximately $102 million to Aave on Ethereum. Excluding Sky, Ethena and Maple’s own wallets, other holders had $1.03 billion on September 30, unchanged from June 30.
Growth elsewhere partly offset those exits. Launched July 1, syrupUSDG reached $176 million in deposits during its first quarter and added $142 million in October. Alea Research reported that much of the syrupUSDG was used as collateral for borrowing on Morpho and Aave V4; a substantial portion of its initial growth entered a Morpho market supporting Robinhood Earn. Aave’s Monad market absorbed $140 million of syrupUSDC, while its Ethereum market added $106 million of syrupUSDT. By October 31, borrowers in a Morpho Arbitrum market had borrowed approximately $115 million in USDG against collateral associated with the newer inflows.
The concentration of institutional deposits remained material. On September 30, an Ethena wallet held $304 million of Maple Institutional’s $350 million in deposits. Ethena withdrew $56 million in late October and requested redemption of approximately $250 million more on November 10.
Utilization, withdrawals and valuation
Alea Research’s revenue breakdown shows why the fee rate mattered. On March 21, loans represented only 27% of deposits: $807 million out of $2.98 billion, with the remainder held in internal allocations, cash, and Aave and Sky strategies. Deposits fell by $1.41 billion from April 16 to 25, with internal allocations meeting most redemptions. Maple subsequently directed more retained funds toward lending. By September, loans equaled 93% of average deposits, while annualized revenue per dollar deposited reached 1.04% after the fee increase; it eased to 0.92% in October. Alea Research found that, without the fee change, September revenue per deposited dollar would have been below June’s level.
Withdrawal timing nevertheless varied. Each Sky redemption request submitted from July 15 to 24 was paid in USDC from the syrupUSDC pool within three hours, while loans declined $220 million and internal allocations declined $139 million. For requests submitted October 31, the median wait was 44 hours, versus roughly three minutes from July 1 through October 27. The queue later paused payouts for 25 hours before November 7 and again for 48 hours before November 9; requests resumed clearing within minutes from November 10. These observations describe different periods, not a fixed redemption time.
Alea Research reported no loan impairments or forced collateral seizures in the syrup pools or secured institutional pools since Maple issued its first open-term loan in June 2023. Maple’s October 30 proof of reserves showed collateralization of 1.4 to 1.7 times for syrup loans and no assets held at Binance. Those historical observations do not establish how future loans or withdrawal queues will perform.
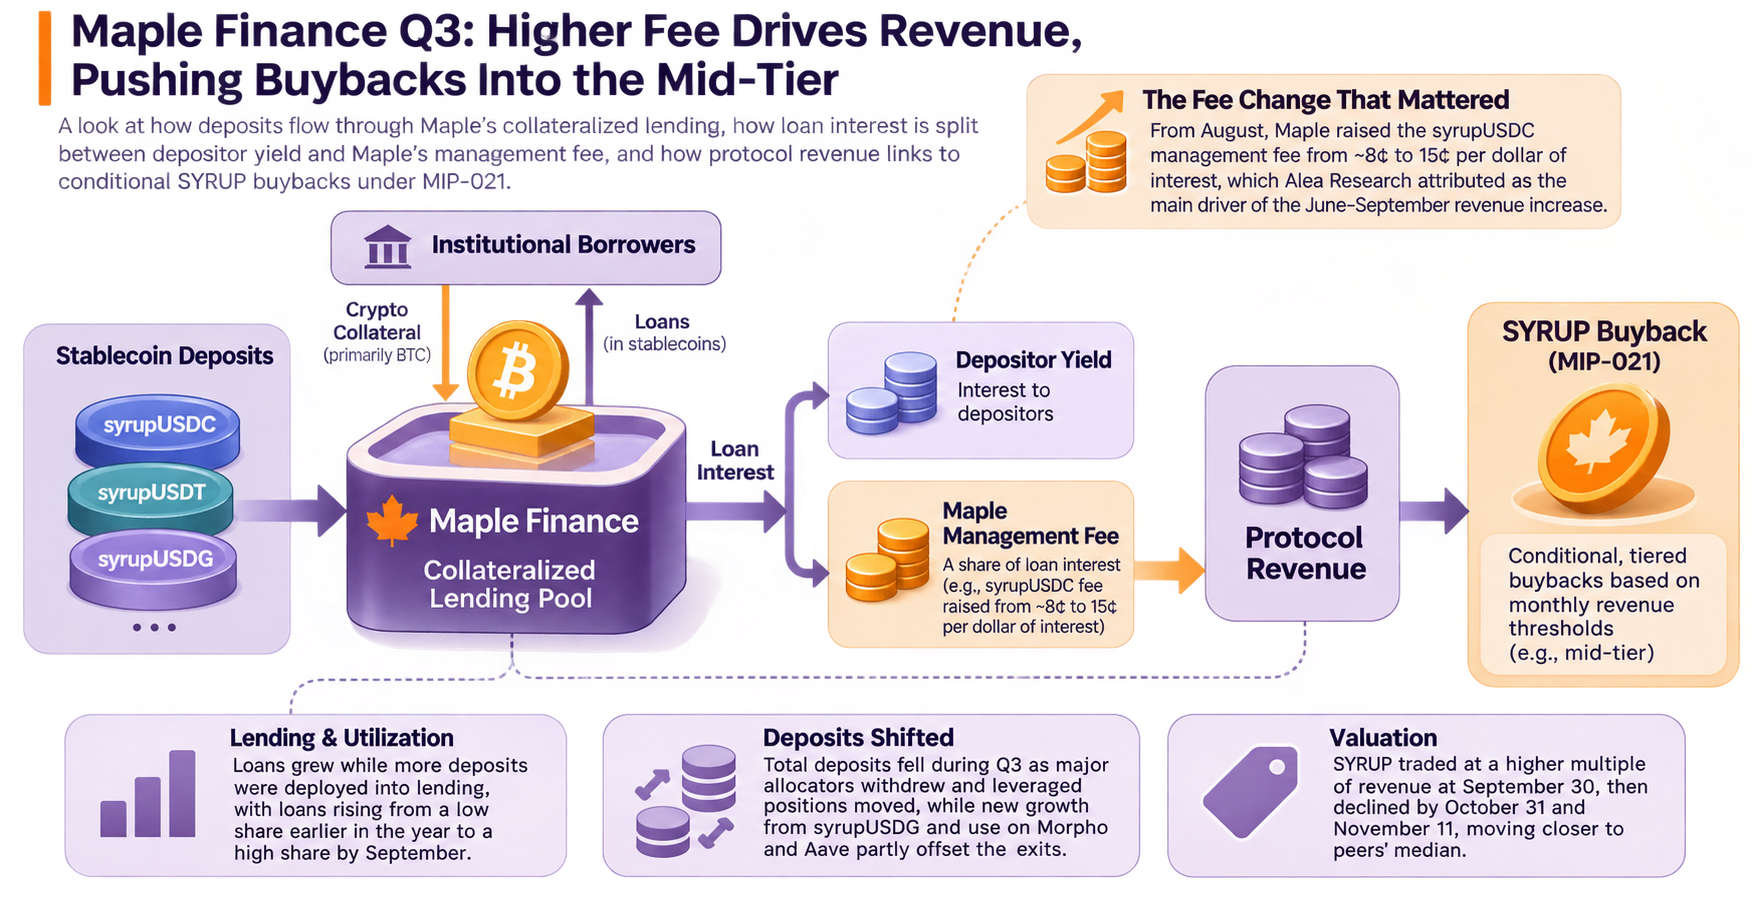
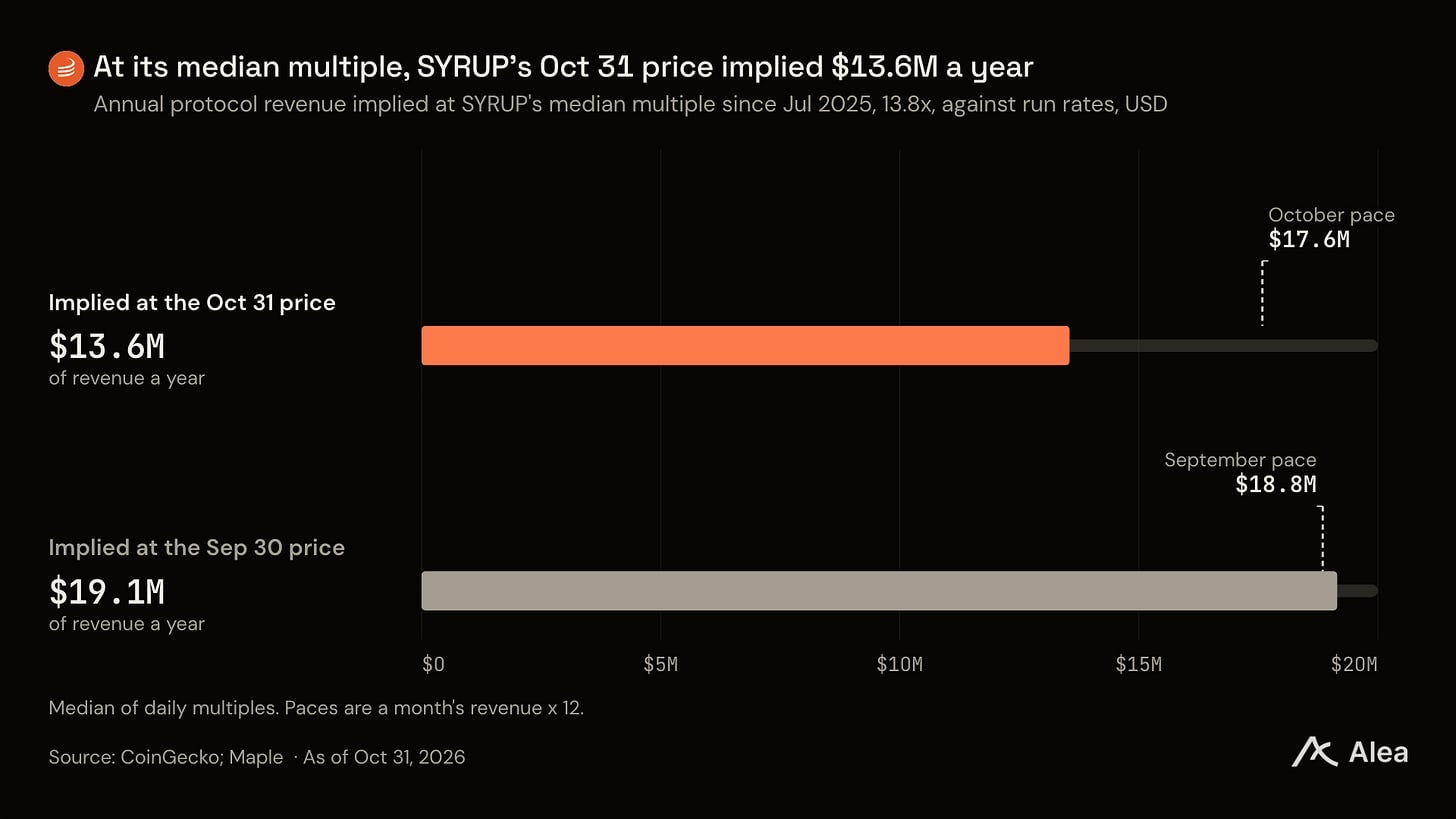
Using CoinGecko prices and Maple Transparency revenue, Alea Research calculated that SYRUP traded at 15.1 times annualized third-quarter revenue at the September 30 close, compared with an 8.5-times median for Aave, Sky and Spark. Its multiple fell to 10.7 times by October 31 and 8.8 times at the November 11 close. These are price-to-revenue comparisons, not a measure of token-holder earnings: at Maple’s own median multiple of 13.8 times since July 2025, Alea Research estimated that the October 31 price implied $13.6 million in annual revenue, versus $17.6 million from annualizing third-quarter revenue.
The next buyback tier remained conditional. Alea Research estimated that reaching the highest tier would require $2.31 billion in deposits at September’s revenue per deposited dollar, or $2.6 billion at October’s rate. Deposits stood at $1.87 billion on October 31 and $1.81 billion on November 7. Future fee generation, deposit levels and withdrawal behavior—not the September result alone—would determine whether Maple crossed another MIP-021 threshold.