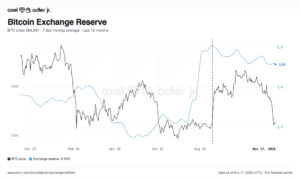
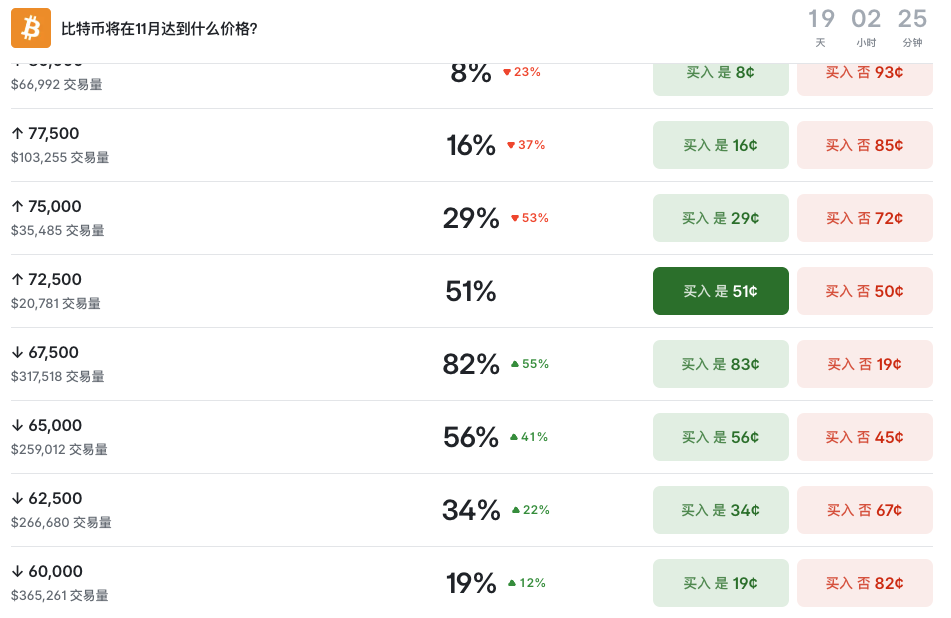
In a report published on November 13, 2026, Odaily examined Bitcoin’s fall below $70,000 through fund flows and measures of crypto-market liquidity. It reported a decline of more than 7% over the preceding 24 hours. The flow figures offer evidence of weaker demand, but they do not establish when—or whether—the price will recover.
ETF outflows and stablecoin supply
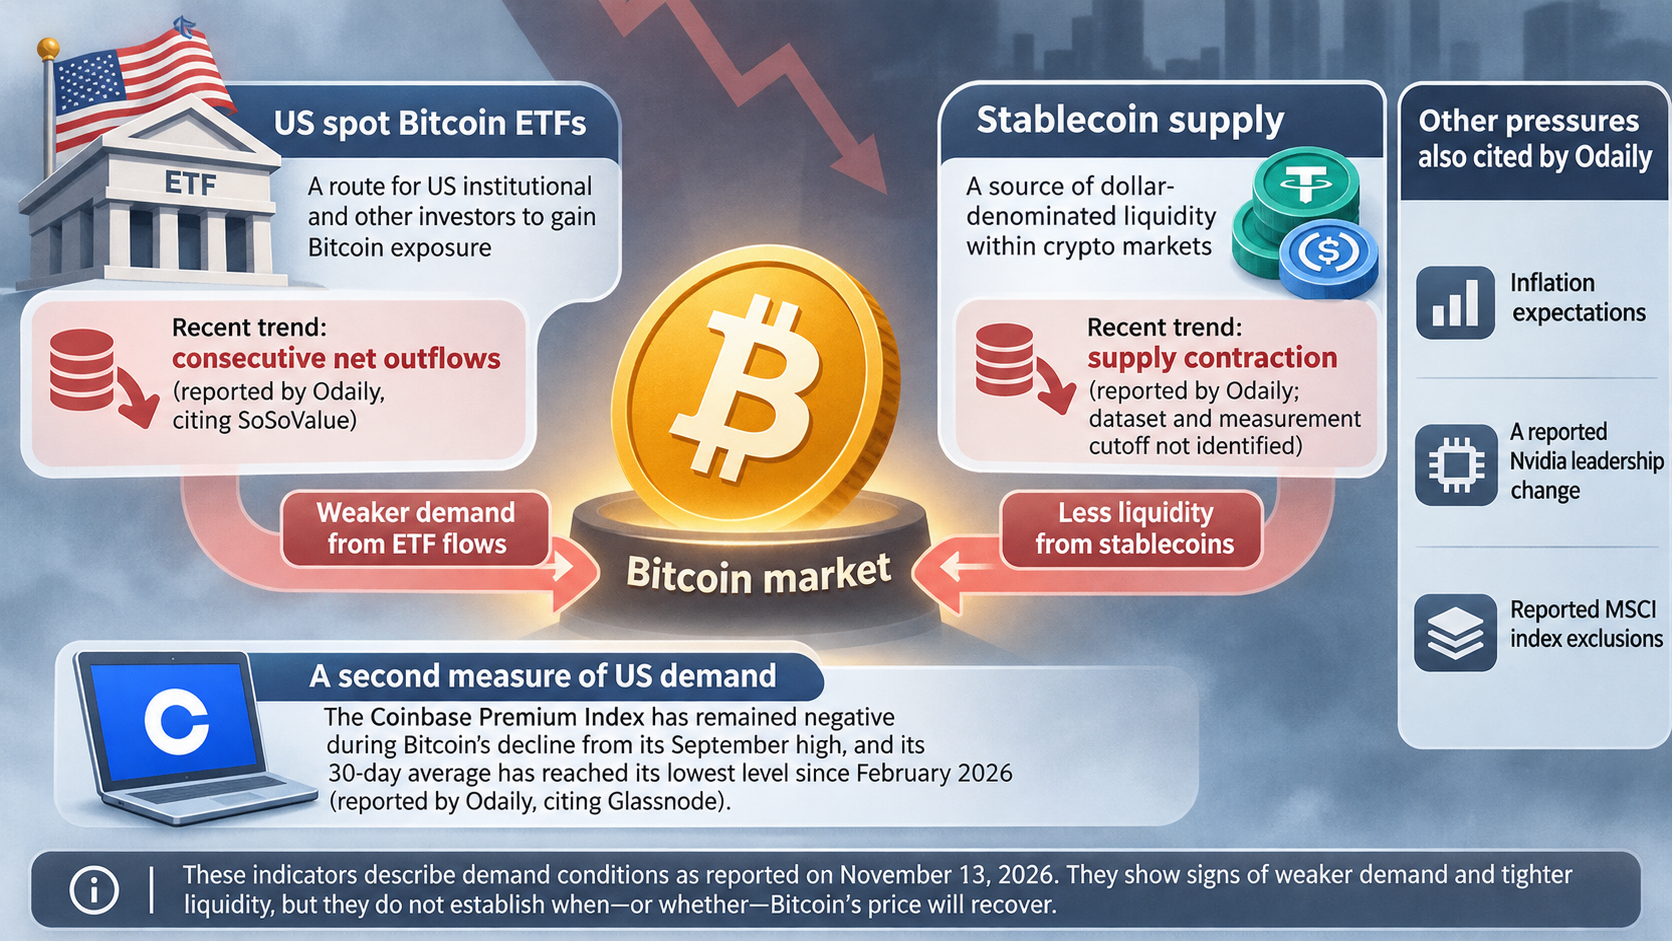
Citing SoSoValue, Odaily reported that US spot Bitcoin ETFs had recorded five consecutive trading days of net outflows totaling more than $1.4 billion. It put the November 11 outflow at $300 million, with BlackRock’s IBIT accounting for most of that day’s figure. The report also stated that the ETFs held $92.7 billion worth of Bitcoin, equivalent to 1.46% of Bitcoin’s market capitalization.
Odaily separately reported a $14.2 billion decline in total stablecoin supply over the preceding 30 days, describing it as the largest 30-day drop since 2022. The report did not identify the dataset or measurement cutoff for that figure. A contraction in supply can indicate less dollar-denominated liquidity within crypto markets; by itself, it cannot establish why holders moved funds or whether they intend to buy Bitcoin later.
A second measure of US demand
Odaily cited a November 13 post by Glassnode saying that the Coinbase Premium Index had remained negative throughout Bitcoin’s decline from its September high. Glassnode said the index’s 30-day average had reached its lowest level since February 2026. That is another indication of subdued US-market demand during the period measured, though Glassnode also noted that previous rallies had begun from similarly deep negative-premium readings.
The report discussed inflation expectations, a reported Nvidia leadership change and reported MSCI index exclusions as additional pressures. Those explanations are distinct from the measured ETF flows and Coinbase premium. Taken together, the cited indicators describe demand conditions as reported on November 13, 2026—not a verified price floor or a forecast.