Glassnode’s note, compiled by 谷昱 for ChainCatcher and published at 23:17 on 11 November 2026 (UTC+8), is a dated snapshot, not a live tape. The question it frames is narrow. Bitcoin had fallen under the short-term holder cost basis, and the pools of cash that could lift it were still shrinking. Did the higher-timeframe turn Glassnode dates to August still stand?
The note’s own answer is a set of conditions, not a completed reversal. On this reading, the August shift remains intact only while price holds above the June low of $58,500. Reclaiming the short-term holder cost basis would support that view. A sustained break of $73,000 would point to a longer consolidation. A close beneath $58,500 would reverse the shift. None of those breaks or reclaims is reported as having happened by the cutoff.
Where the last 155 days of coins sit
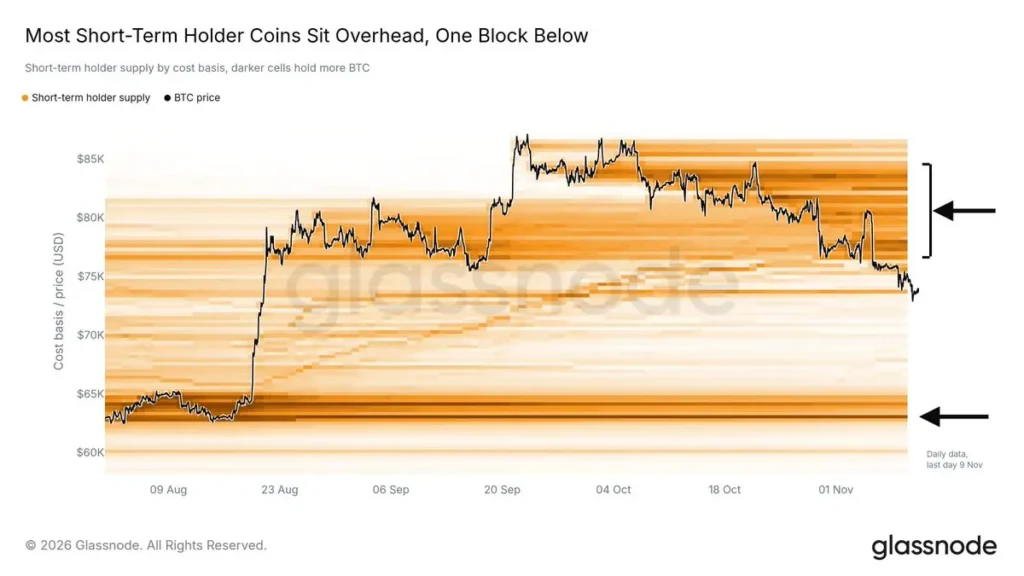
In the prior week’s assessment, $73,000 to $76,000 was the band to watch. Bitcoin had since moved into that band and was trading near $74,000, below the short-term holder cost basis of $75,600. That basis is the average price paid by investors who bought in the previous 155 days.
At the September high, almost every short-term holder coin was in profit. In this snapshot about 35% were in profit, and the coins being sold were sold, on average, at a small loss.
Cost-basis distribution shows where those coins were bought. About two-thirds sat above the prevailing price, spread across three bands acquired from August through October and reaching as high as $83,600. The note’s behavioral reading is that many of those holders might use a bounce to exit near breakeven. That is an expectation about possible supply, not a measured wave of selling. Below the price, the only dense block was $62,000 to $66,000, bought near the August low.
The broader structure cited from August was still described as in force. The September high was the first higher high since the 2025 all-time high, and price was still well above the June low of $58,500. A reclaim of the True Market Mean at $77,500 would, on Glassnode’s figure, put about half of short-term holder coins back in profit. The compiled text names the level and the profit share. It does not restate how the True Market Mean is constructed.
Equities and the rates gap
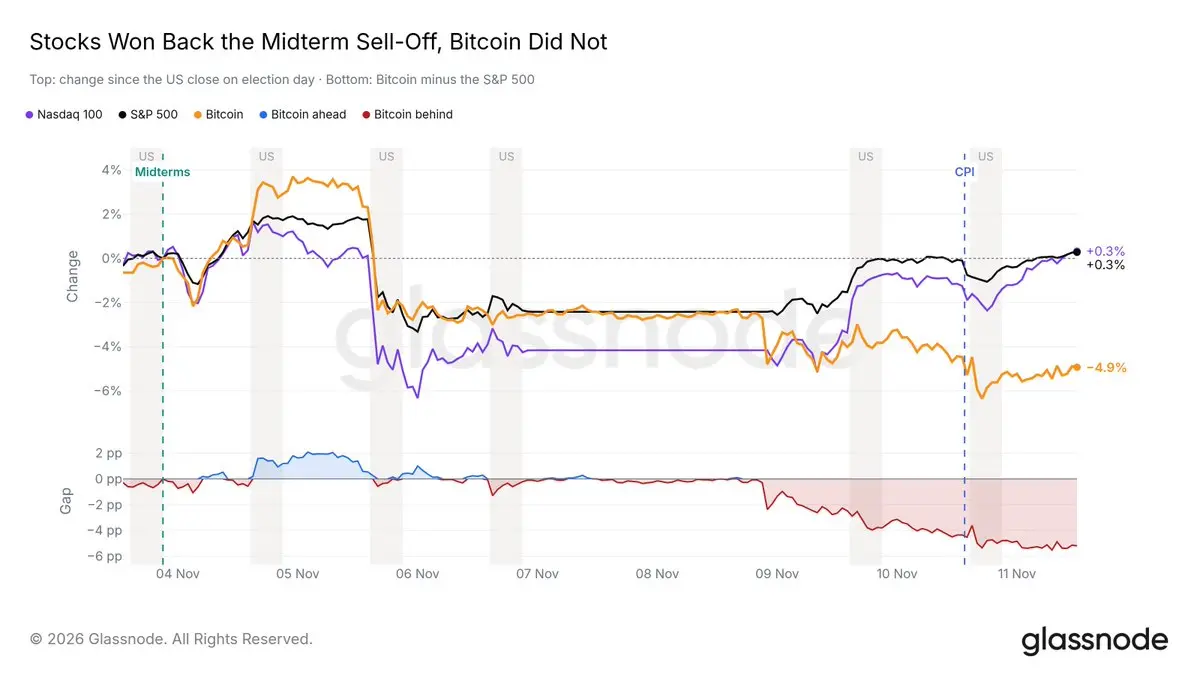
Most of Bitcoin’s intermediate decline, the note says, had already taken place before the vote. The selling that started on 5 November then hit equities and Bitcoin at the same time. From 9 November the paths diverged. The S&P 500 and the Nasdaq 100 had recovered above their election-day closes. Bitcoin fell again after the CPI release on 10 November and was still down about 5%. The compilation does not report the CPI number, nor does it state the base for that 5%.
Standing back above Bitcoin’s own election-day close of $77,800 would, in the note, put the coin back in line with equities. That level is a threshold, not a level the market had retaken.
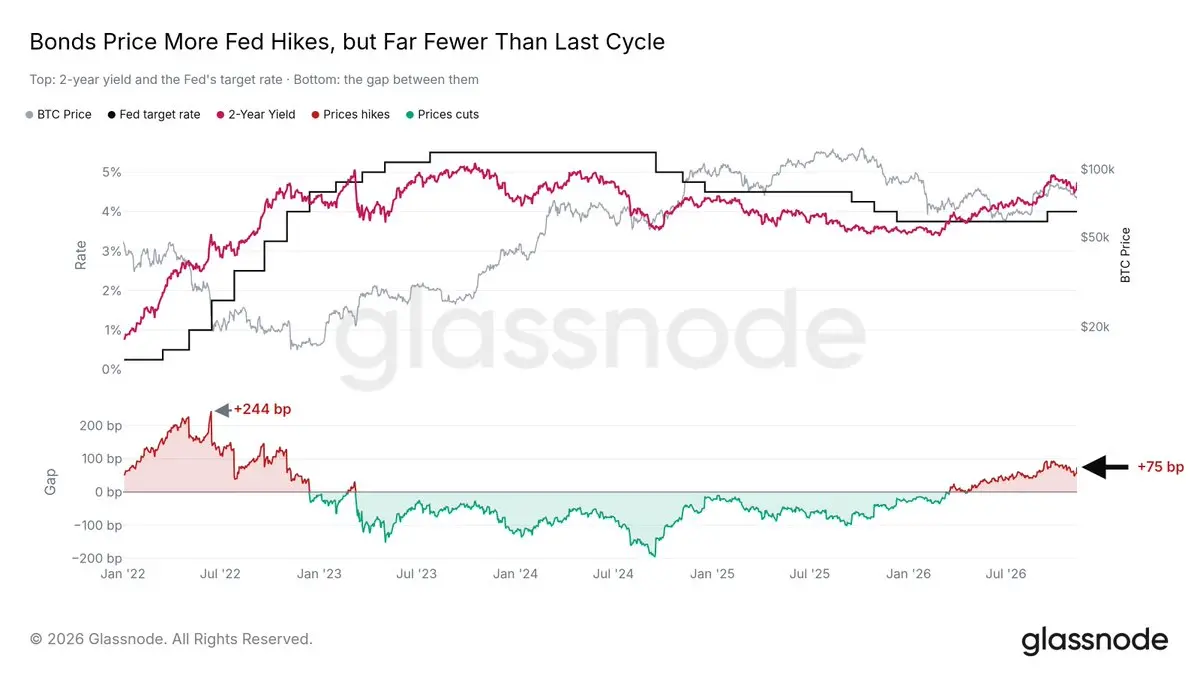
Rates were adding pressure. The two-year Treasury yield is used here as the trader-implied average of the Federal Reserve’s policy rate over the next two years. It was 4.75%, 75 basis points above the Fed’s then-current 4% rate, so the bond market was priced for further hikes.
The same passage marks the distance from 2022. In June 2022 that gap peaked at 244 basis points. The gap in this snapshot was about one-third as wide, and it had narrowed since late October. Higher rates were still a headwind for risk assets. The bond market was not, on this evidence, priced for a repeat of 2022.
Stablecoins, ETFs, and the US premium
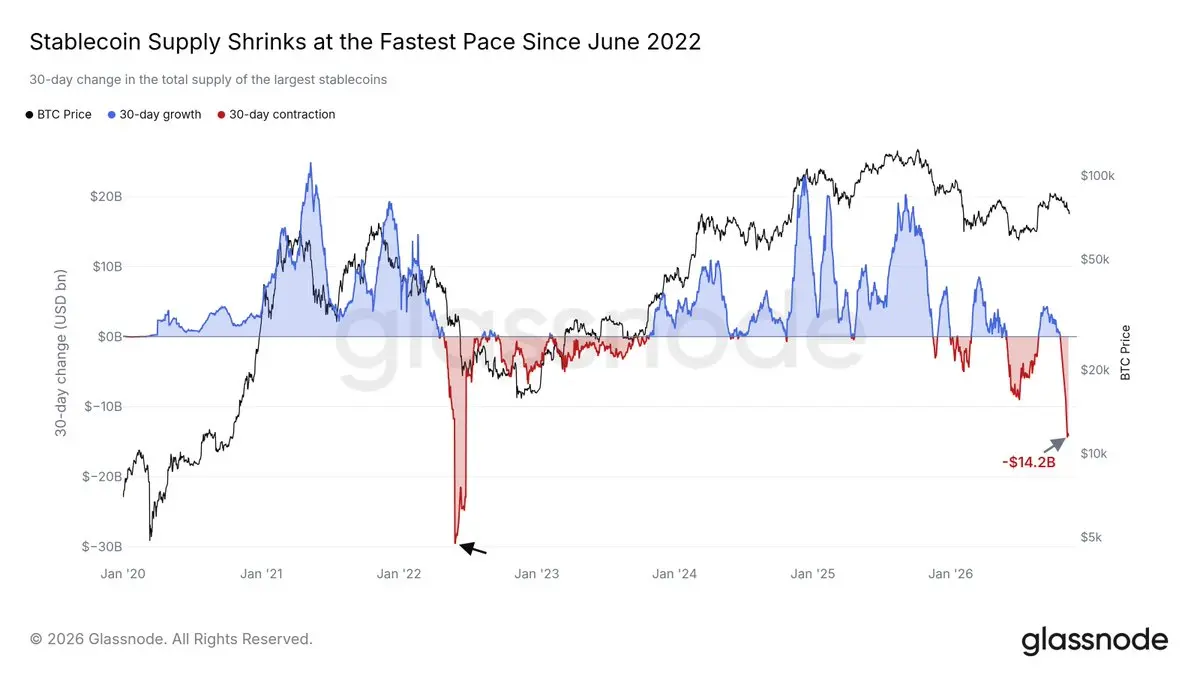
The note treats stablecoins as the market’s cash: dollars held on exchanges and on-chain ahead of a purchase. Over the prior 30 days, total stablecoin supply fell by $14.2 billion, the fastest contraction since June 2022. Shrinking supply means holders were redeeming stablecoins for dollars and taking that cash out of the market, which leaves less fuel for a rally. Tether itself was trading slightly below $1. If the 30-day supply change turned back to growth, the note calls that the first sign of new money coming in. It had not turned.
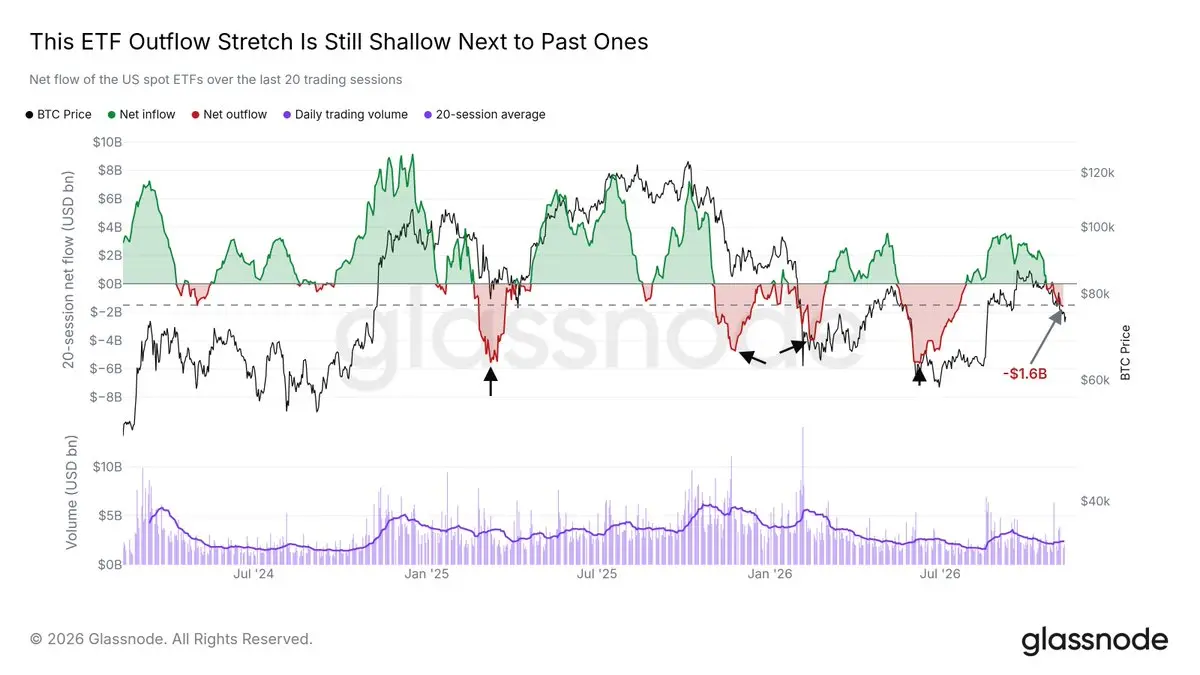
US spot ETFs had become net sellers. Across the prior 20 trading sessions they recorded $1.6 billion of net outflows, and on 9 November that total crossed the $1.5 billion mark Glassnode uses to define an outflow regime. Against earlier outflow regimes this one was still shallow; most of those earlier stretches were much deeper. The text does not give the earlier amounts. It does say that inflows returned, in every previous case, only after Bitcoin had made a low, so a return of inflows confirms a low after the fact.
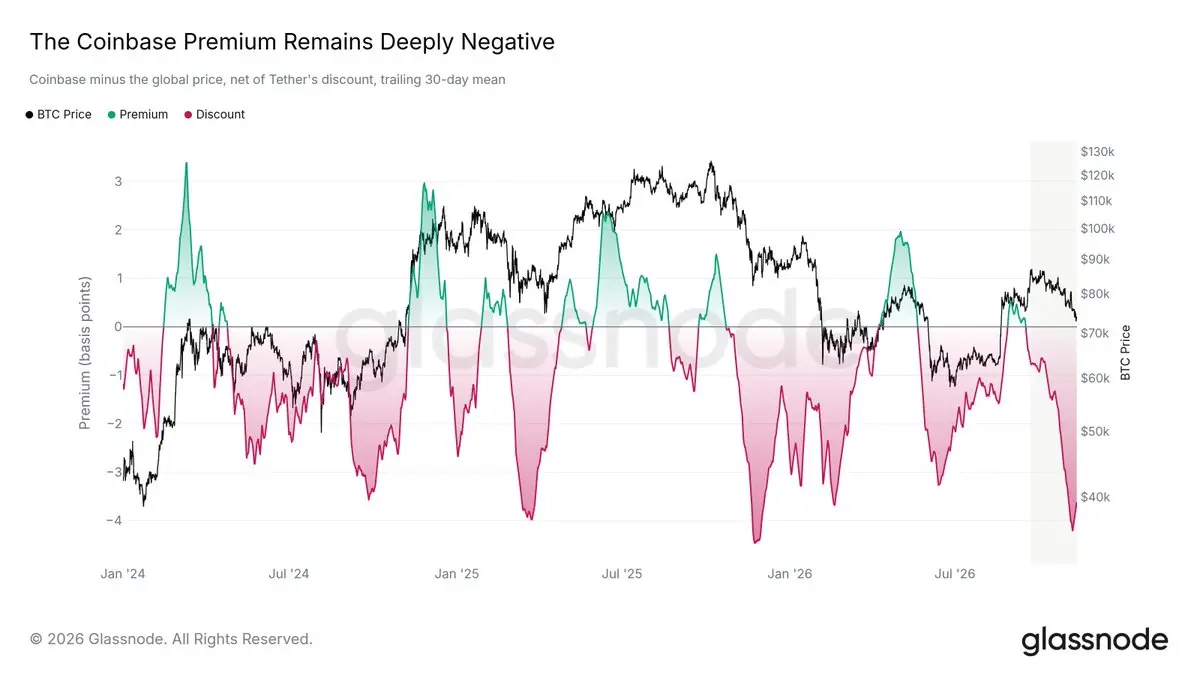
The Coinbase premium compares the Bitcoin price on Coinbase, called the main venue for US investors, with the global price. The series strips out the portion of the gap caused by Tether trading under $1. Without that adjustment the discount would look deeper than it was. On a 30-day average the premium had been negative throughout the decline from the September high, and the discount was the deepest since February. The compiled sentence does not name the year of that February. In past rallies the premium turned positive because US buyers were willing to pay up. They were not doing so here. A premium that turned positive and held for several weeks would indicate US demand coming back. That is a condition, not an observation already met.
What the book and the heatmap show near the price
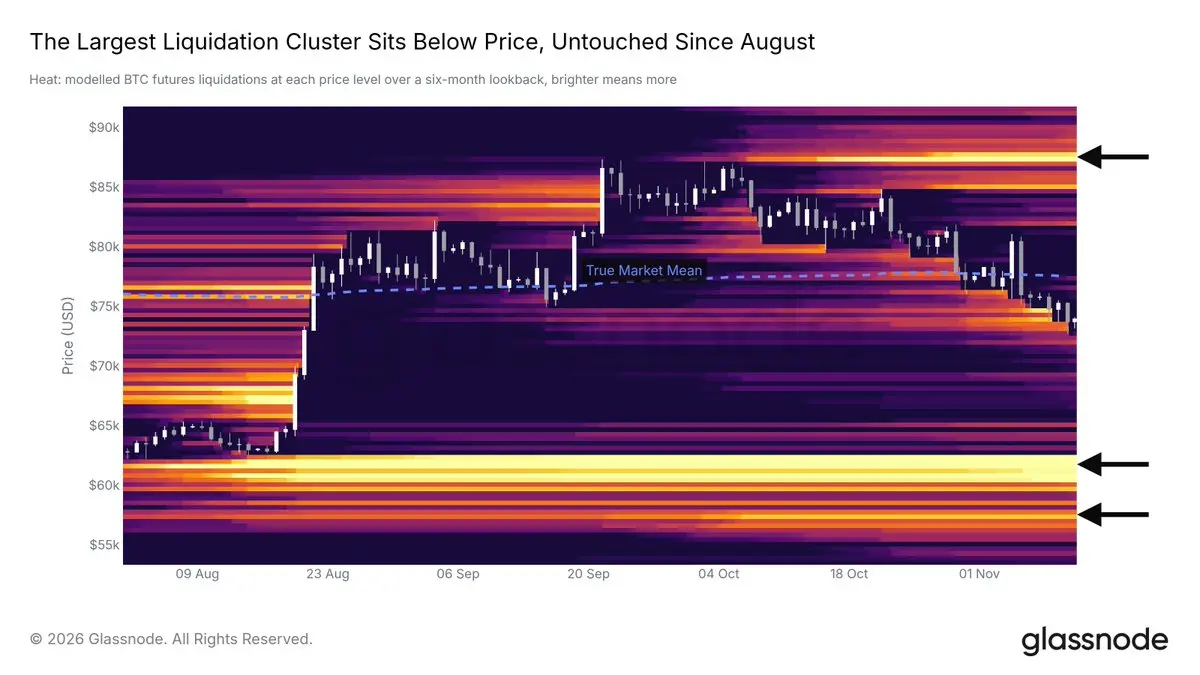
A liquidation heatmap simulates the prices at which leveraged futures would be forced closed. The slow decline from the September high had already moved through most of the long-liquidation levels that had built up on the way down, the dark areas the report describes as following the candles. That removes most of the fuel for a cascade of forced selling near the price.
On the six-month heatmap the largest cluster was far below the market, between $59,500 and $62,600, and had not been touched since the August low. The stretch between that cluster and the price was relatively thin. Open interest had nevertheless returned to its level at the September high, despite a price decline of about 15%. The note reads the rebuilt open interest as short positions added during the drop. If price turned higher, those shorts would have to buy to cover. The largest cluster above the price sat near $87,500.
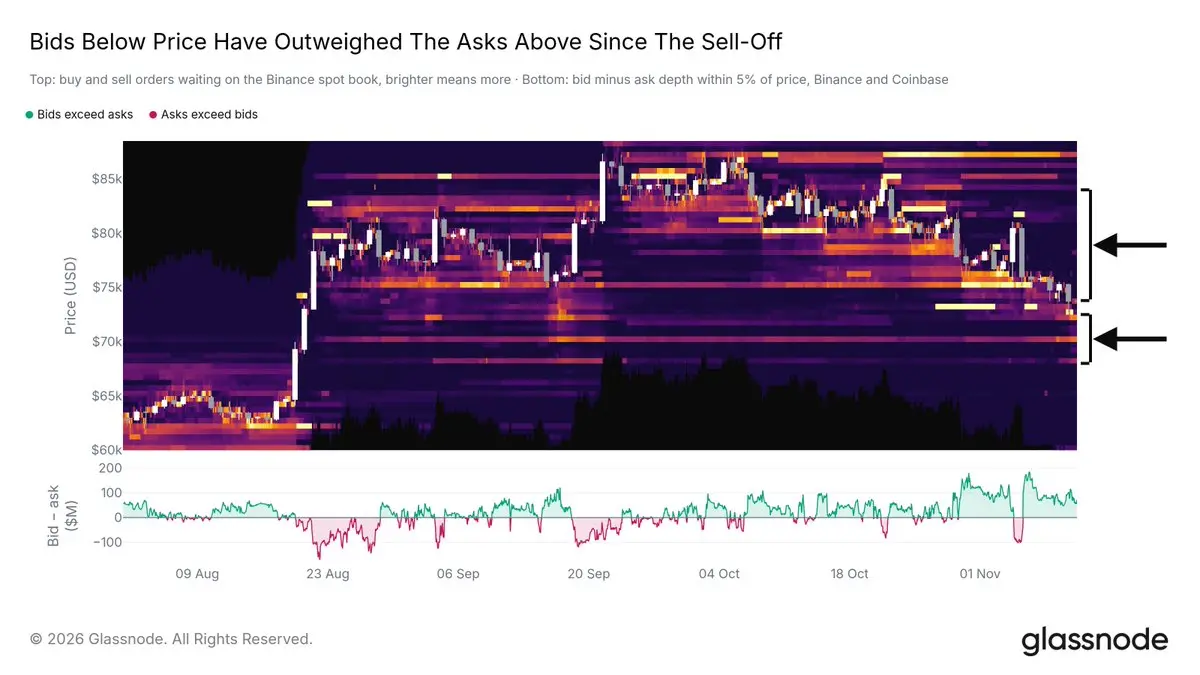
The spot order book had the same tilt, inside a narrow window. Since the 5 November selloff, resting bids within 5% of the price on Binance and Coinbase exceeded asks in every hour. The largest bid block was $68,000 to $72,500. Past the offers immediately above the market, the book was thin up to about $84,000, described as the dark stretch on the heatmap. An advance would meet little resistance from resting orders and would still have to pass short-term holders waiting to leave at breakeven. Resting orders can be cancelled. The note records that some bids were pulled during the selloff and put back later.
Two cohorts bought; the rest did not
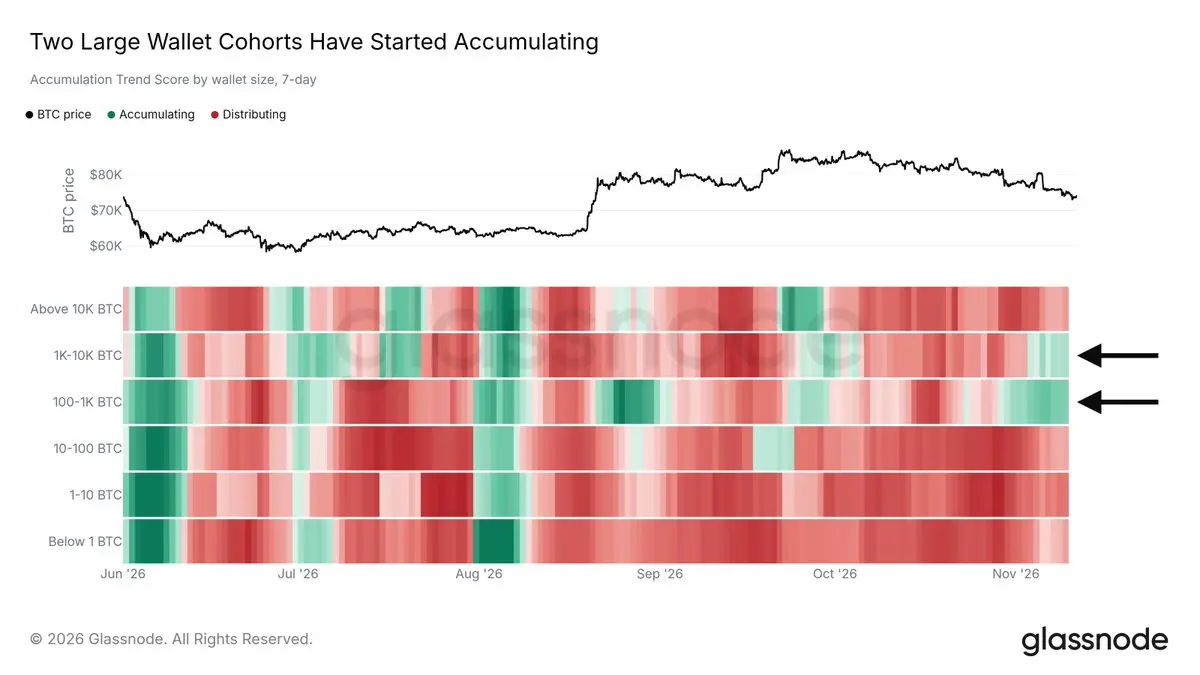
The Accumulation Trend Score measures whether each wallet cohort is increasing its balance, a score near 1, or reducing it, a score near 0, with the result weighted by wallet size. Over the week covered here, two cohorts scored above 0.5: wallets holding 100 to 1,000 BTC, and wallets holding 1,000 to 10,000 BTC. Both had been distributing through most of October. Both had also turned to buying in late September, and that turn did not last.
Every other cohort was still cutting holdings, from wallets above 10,000 BTC down to wallets under 1 BTC. The report calls this early buying of a dip by a narrow group. If smaller cohorts joined, that would show buyers returning across the market. On the score as published, they had not.
The structure the note still treats as open
The documented state is a pullback with almost no new capital underneath it. Recent buyers were at a loss. Bitcoin was behind the equity rebound. Stablecoin supply, US spot ETF flows, and US venue pricing all pointed to money leaving. The note says there was little near-term cause for optimism.
Against that, most long leverage near the price had been cleared, bids inside 5% outnumbered offers on the two books measured, and two wallet bands — the 100 to 1,000 BTC cohort and the 1,000 to 10,000 BTC cohort, not the wallets above 10,000 BTC — had begun to accumulate.
For a reader who already treats August as the start of a higher-timeframe reversal, the note places this area as the zone where mean reversion would start. Reclaiming the $75,600 short-term holder cost basis would support that reading. A sustained move under $73,000, the floor of the prior week’s range, would point to a longer consolidation. A close under the June low of $58,500 would reverse the August shift. Those sentences are Glassnode’s conditions. They are not a price target, and nothing here adds one.
Clocks, approximations, and what is not shown
The series do not share one timestamp. Price and derivatives are as of 11:00 UTC on 11 November 2026. The order book is as of 09:00 UTC the same day. ETF flows, stablecoin supply, cost basis, and the accumulation score are as of 9 November. Several magnitudes are stated as approximations: about 35% of short-term holder coins in profit, a decline of about 5%, a price drop of about 15%, about two-thirds of the relevant coins above the market, about half of them back in profit at the True Market Mean, and a small average loss on coins sold.
The buying by the two cohorts is a one-week reading, and the same cohorts’ late-September buying did not persist. Displayed bids can disappear. On the history cited, ETF inflows have confirmed lows only afterward. The compilation is not an audit, a valuation, or a test of whether August was in fact a reversal. It is one desk’s map of cost basis, flows, and positioning, relayed by ChainCatcher, with the limits above left in view.
Source: chaincatcher.com (originally published 2026-11-11 23:17 UTC+8)