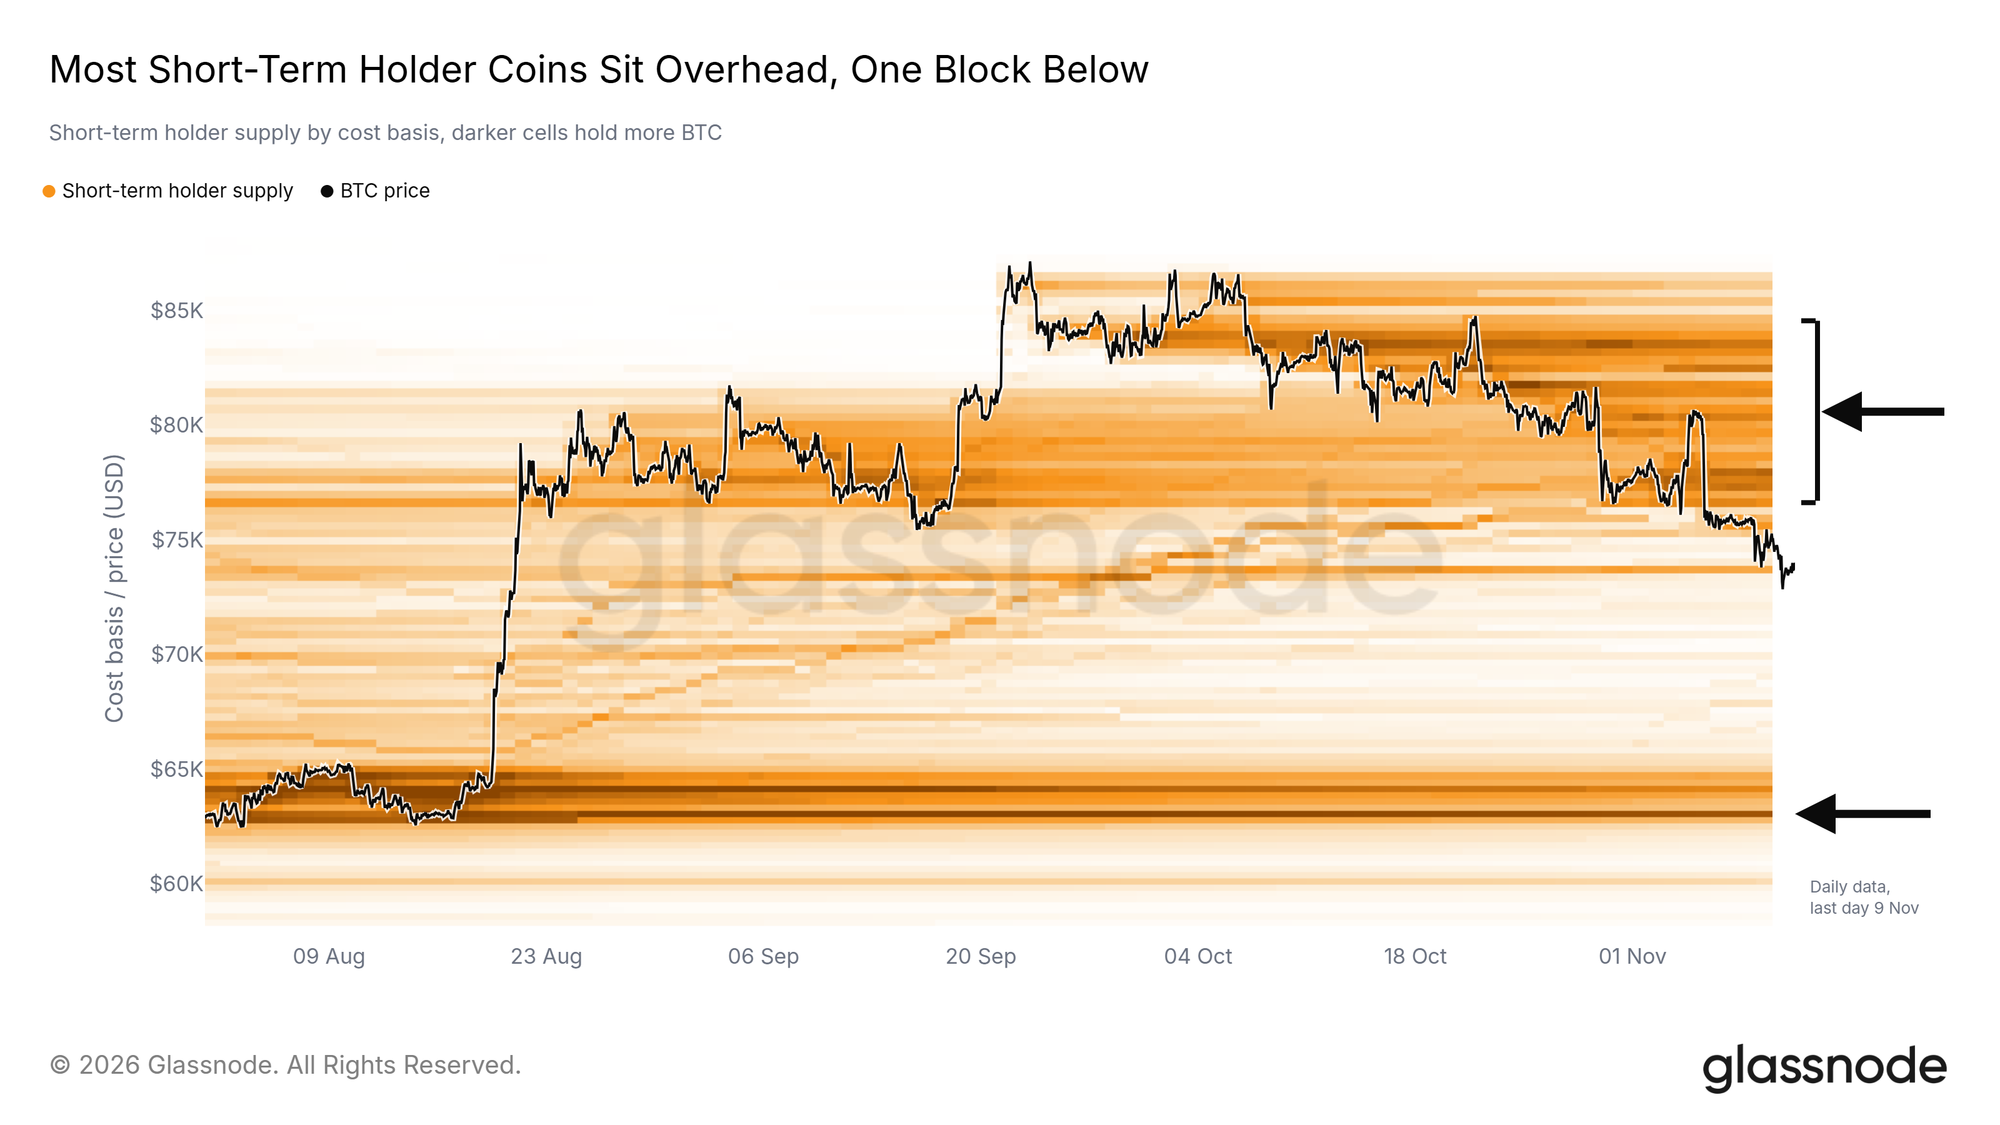
In a Glassnode analysis published on November 12, 2026, bitcoin was trading near $74,000, below the $75,600 average cost basis of short-term holders—investors who had acquired their coins within the preceding 155 days. The report’s central tension was that potential buying power appeared to be leaving the market even as some measures of selling pressure had eased.
The data have different cutoffs. Glassnode’s price and derivatives figures run through 11:00 UTC on November 11, and its spot order-book data through 09:00 UTC that day. ETF flows, stablecoin supply, cost-basis measures and accumulation scores run through November 9.
Recent buyers face overhead supply
Glassnode estimated that about 35% of short-term-holder coins remained in profit, down from nearly all of them at September’s peak. Roughly two-thirds of those coins had been acquired above the prevailing price, across three concentrations of purchases made from August through October and extending as high as $83,600. Holders seeking to exit at their purchase price could therefore add selling pressure to a rebound. Below spot, the report identified a concentrated cost-basis area at $62,000–$66,000.
The broader price structure had not yet broken under Glassnode’s framework. September marked the first higher swing high since bitcoin’s 2025 all-time high, while price remained above June’s $58,500 low. The report identified $75,600 as the short-term-holder cost basis to reclaim, $77,500 as its True Market Mean, and a sustained move below $73,000 as a sign of potentially longer consolidation. A decisive close below $58,500 would invalidate its August-based reversal thesis.
Funding and US demand weaken
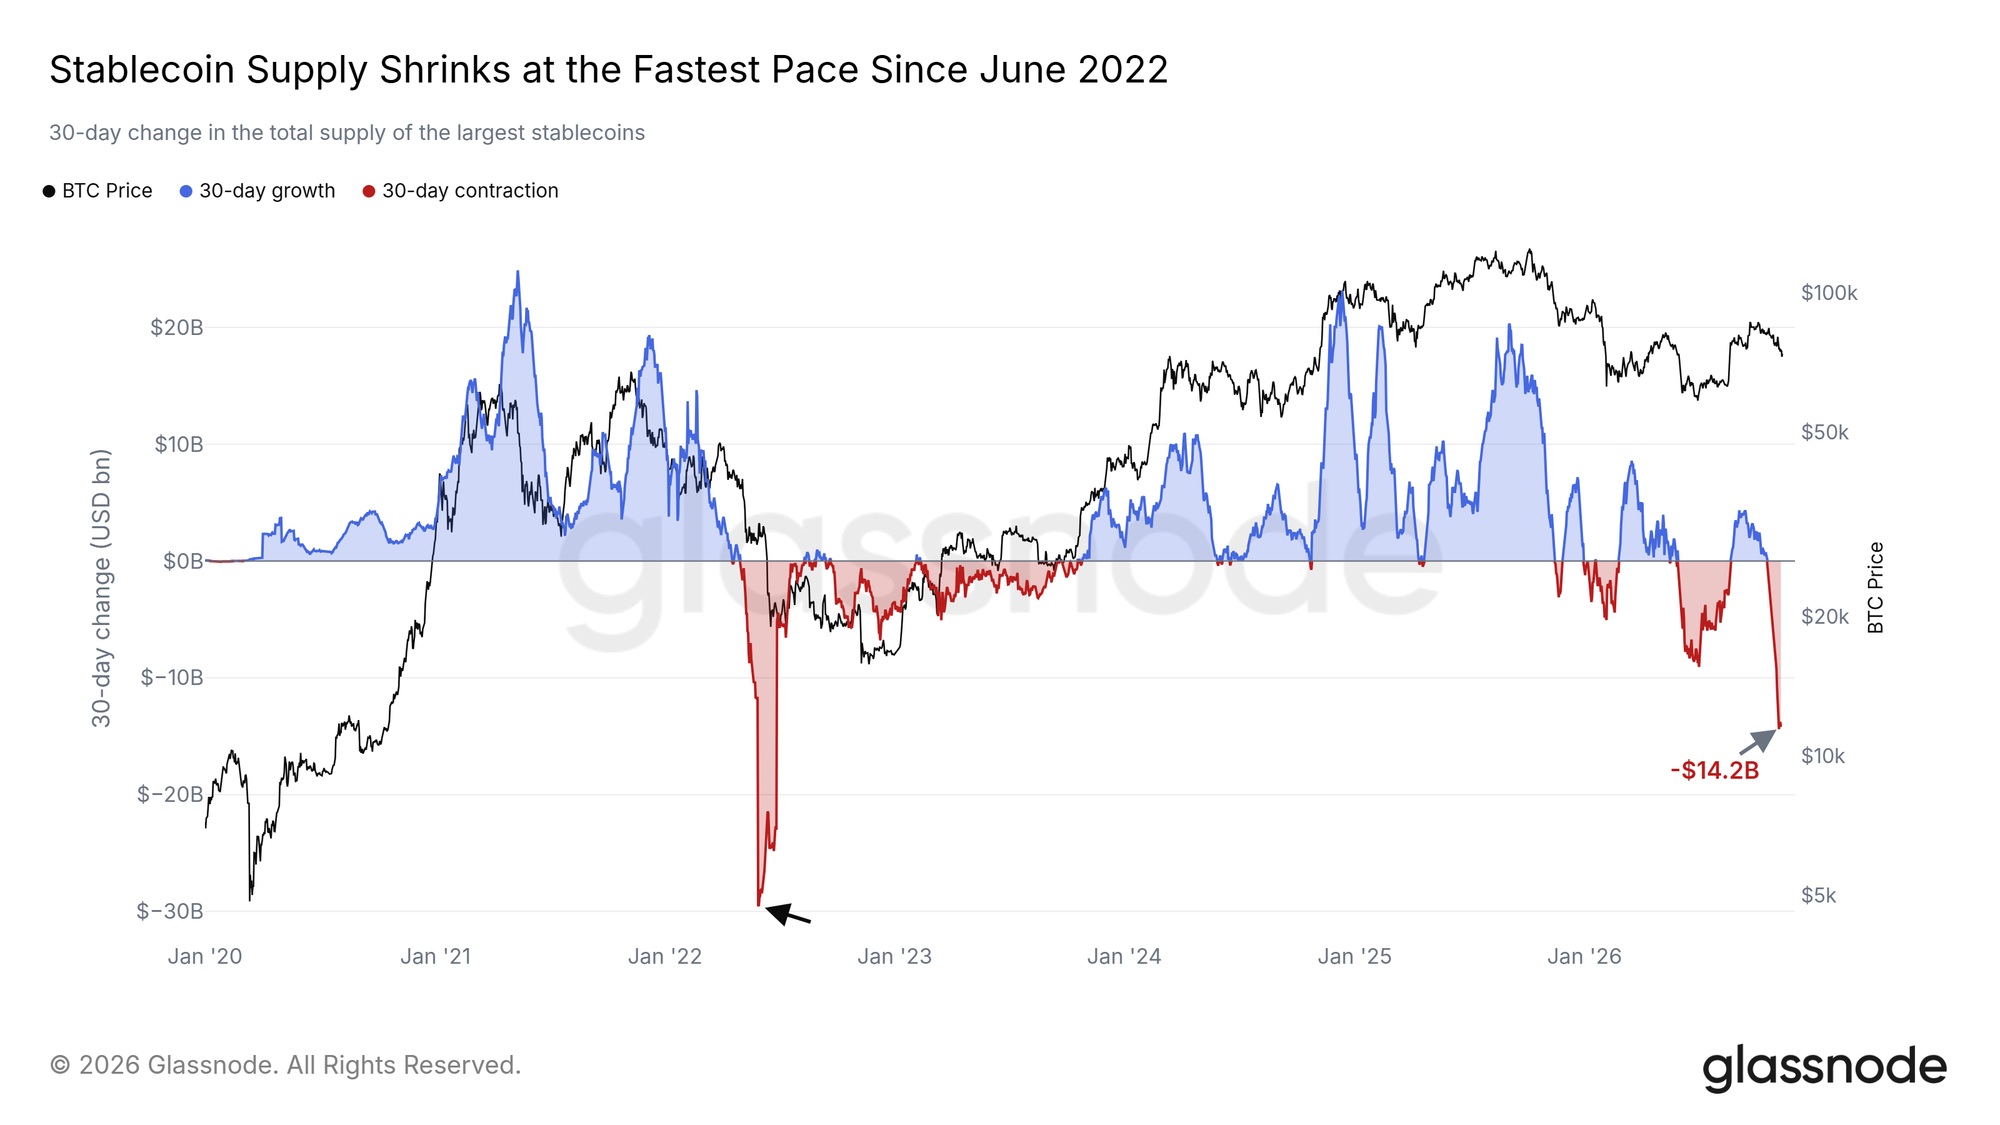
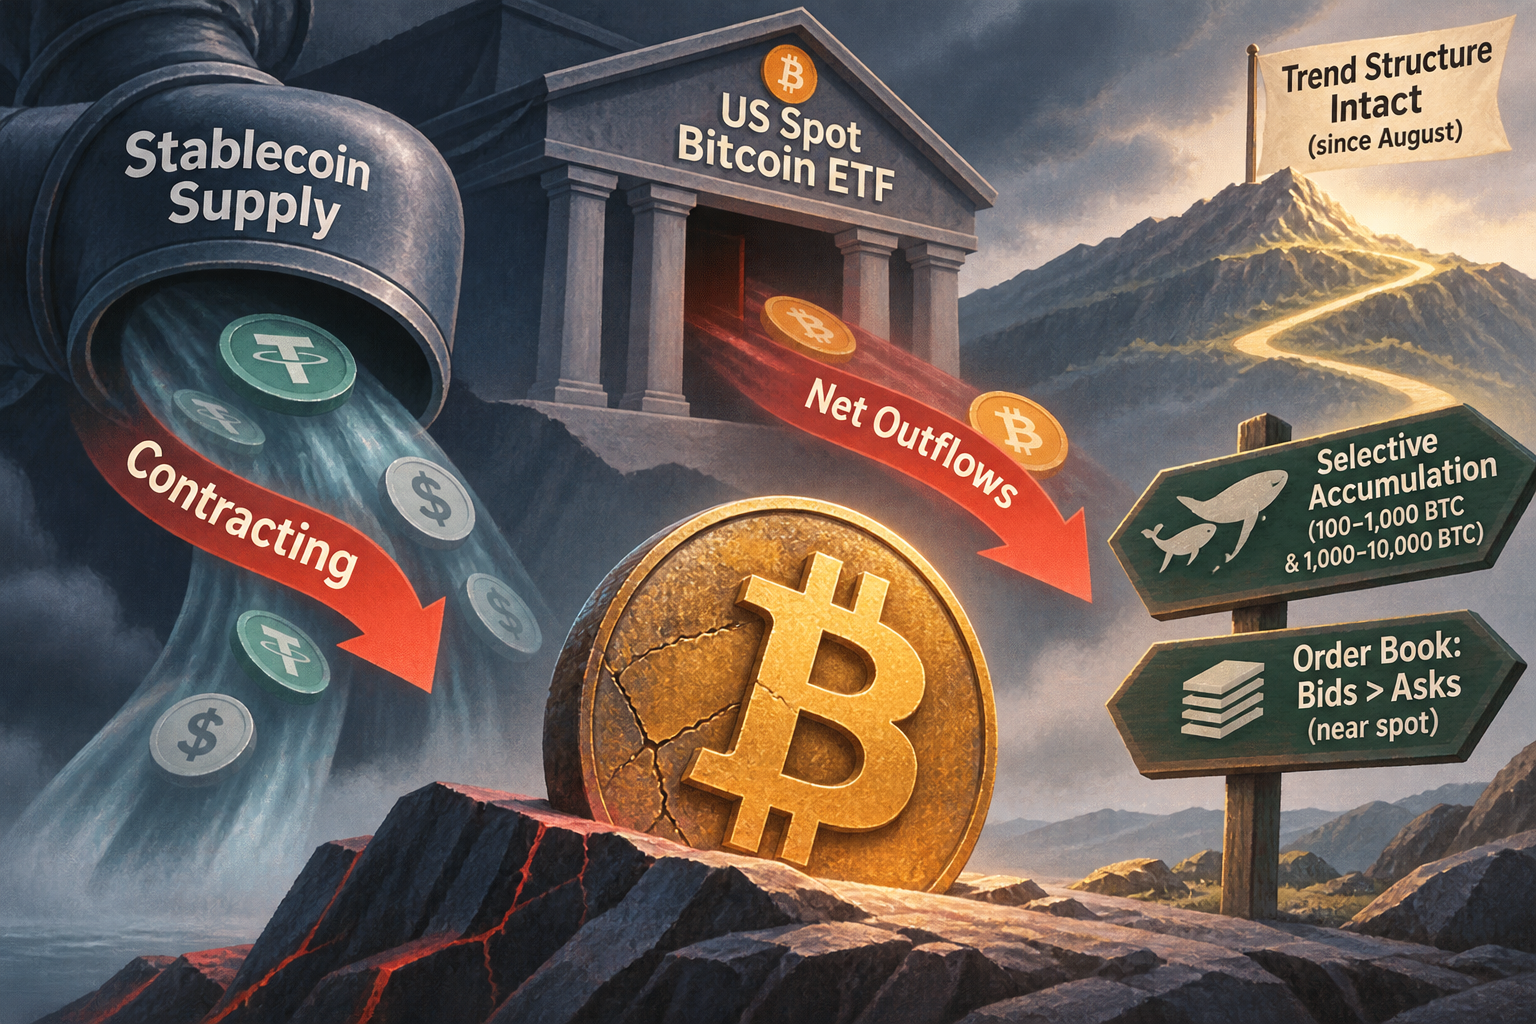
Across the network, total stablecoin supply fell $14.2 billion over 30 days, its fastest contraction since June 2022, according to Glassnode. The report interpreted that decline as evidence of capital leaving crypto rather than remaining in stablecoins ready to buy assets. Supply change alone, however, does not identify what every holder did with the proceeds. Glassnode also noted that Tether was trading slightly below its $1 peg.
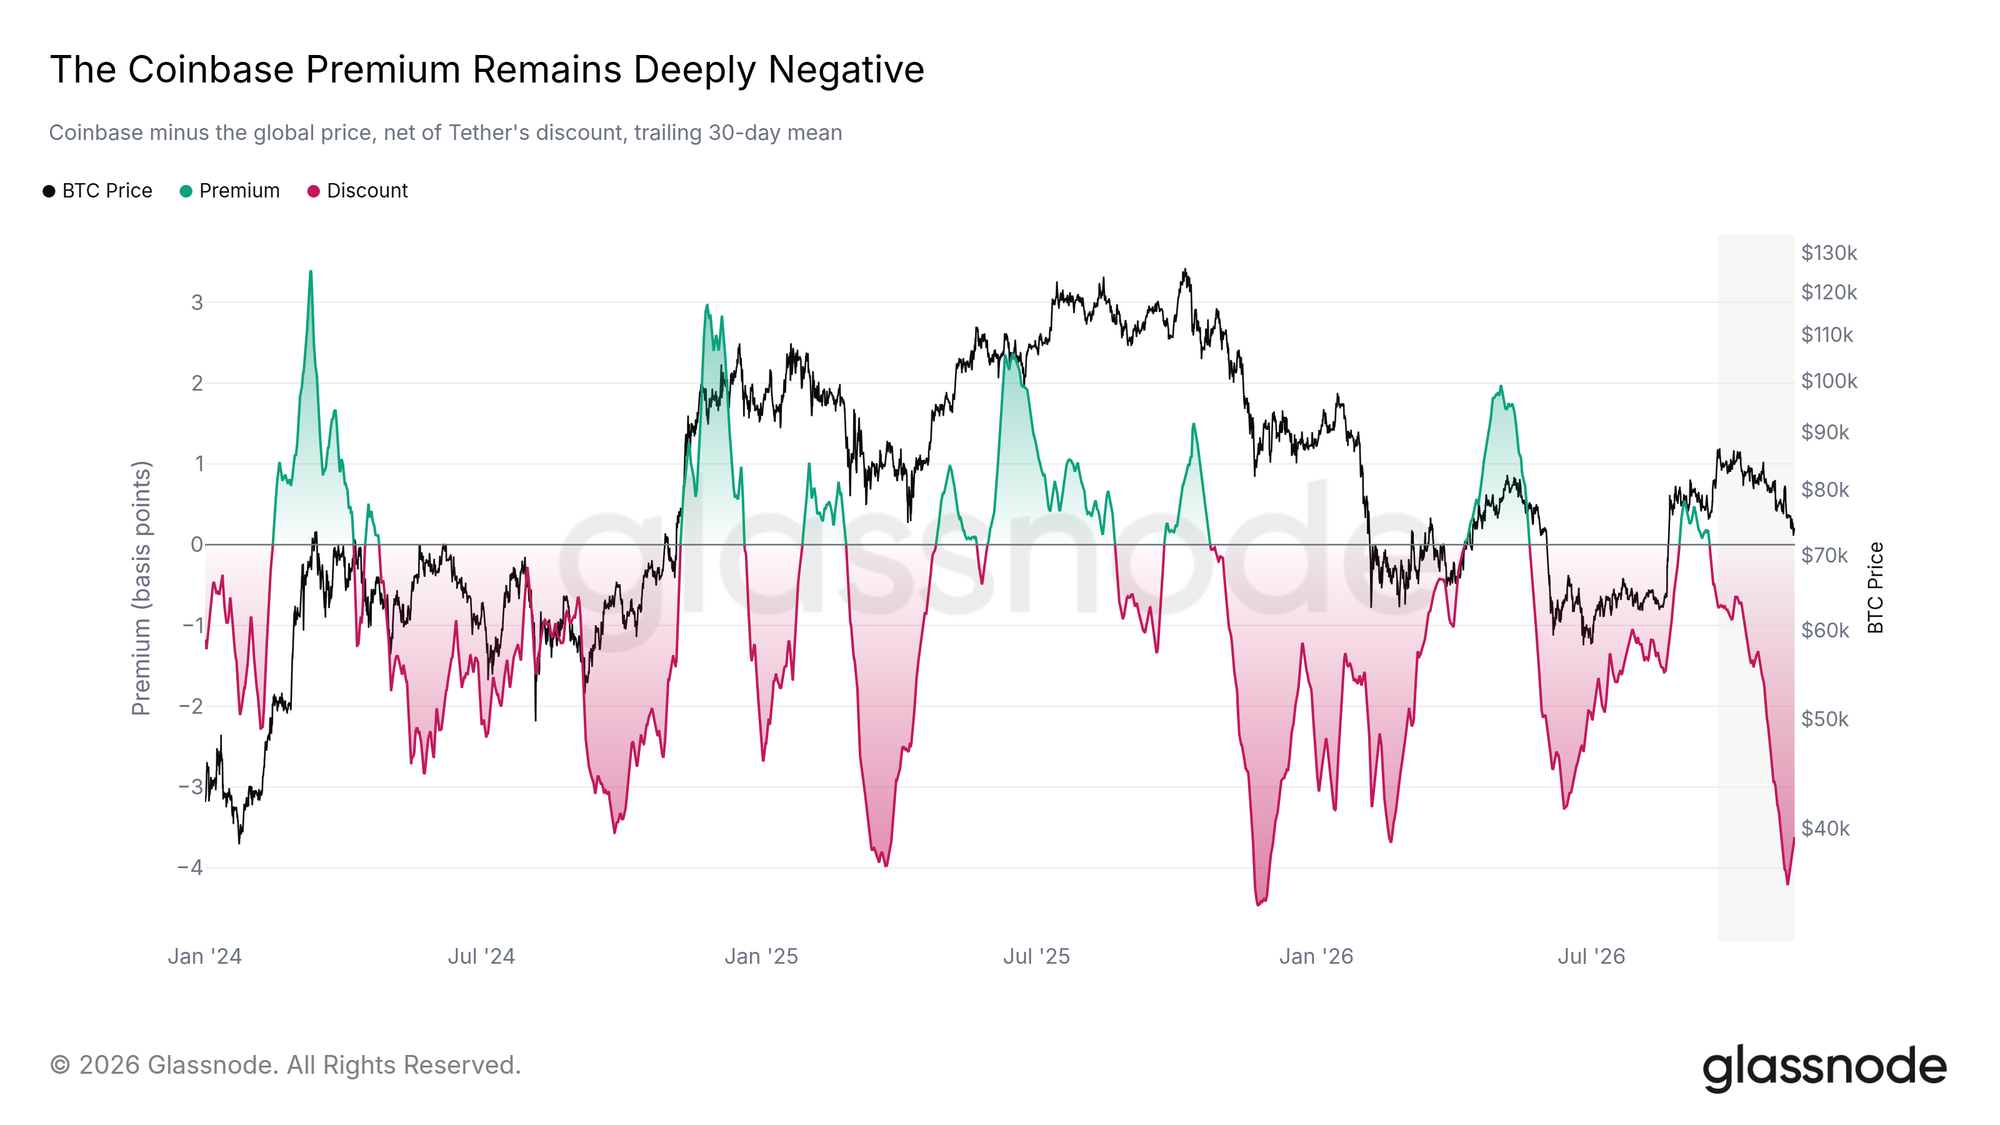
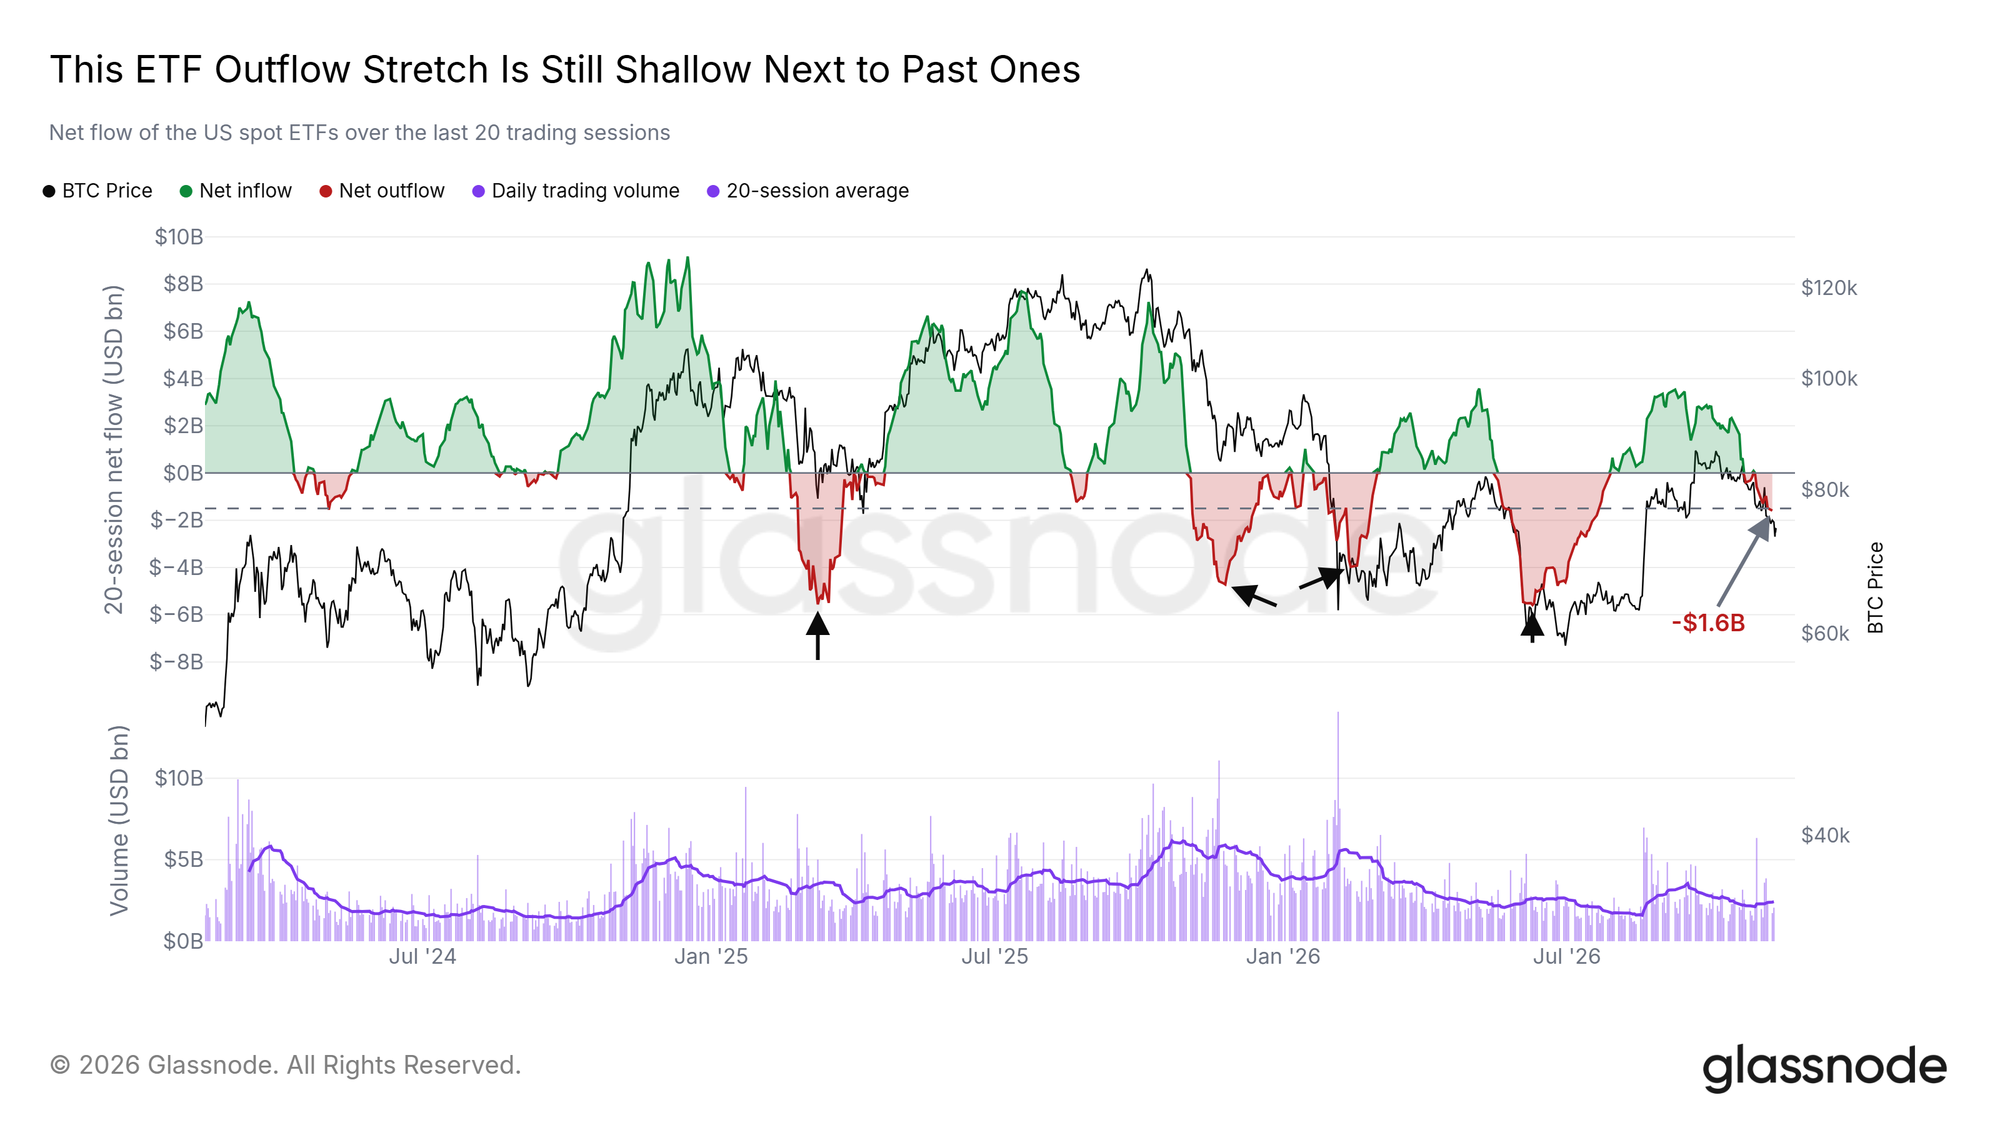
US spot bitcoin ETFs recorded $1.6 billion in net outflows over 20 trading days. On November 9, the cumulative outflow passed Glassnode’s $1.5 billion threshold for what it calls a sustained outflow period, though the report described this episode as shallower than most earlier ones. Its 30-day average Coinbase premium—the price difference between Coinbase and a global composite—remained negative and had reached its lowest level since February. Glassnode said its calculation adjusted for distortion from Tether trading below peg. Taken together, these are measures of weaker demand, not proof of when it will return.
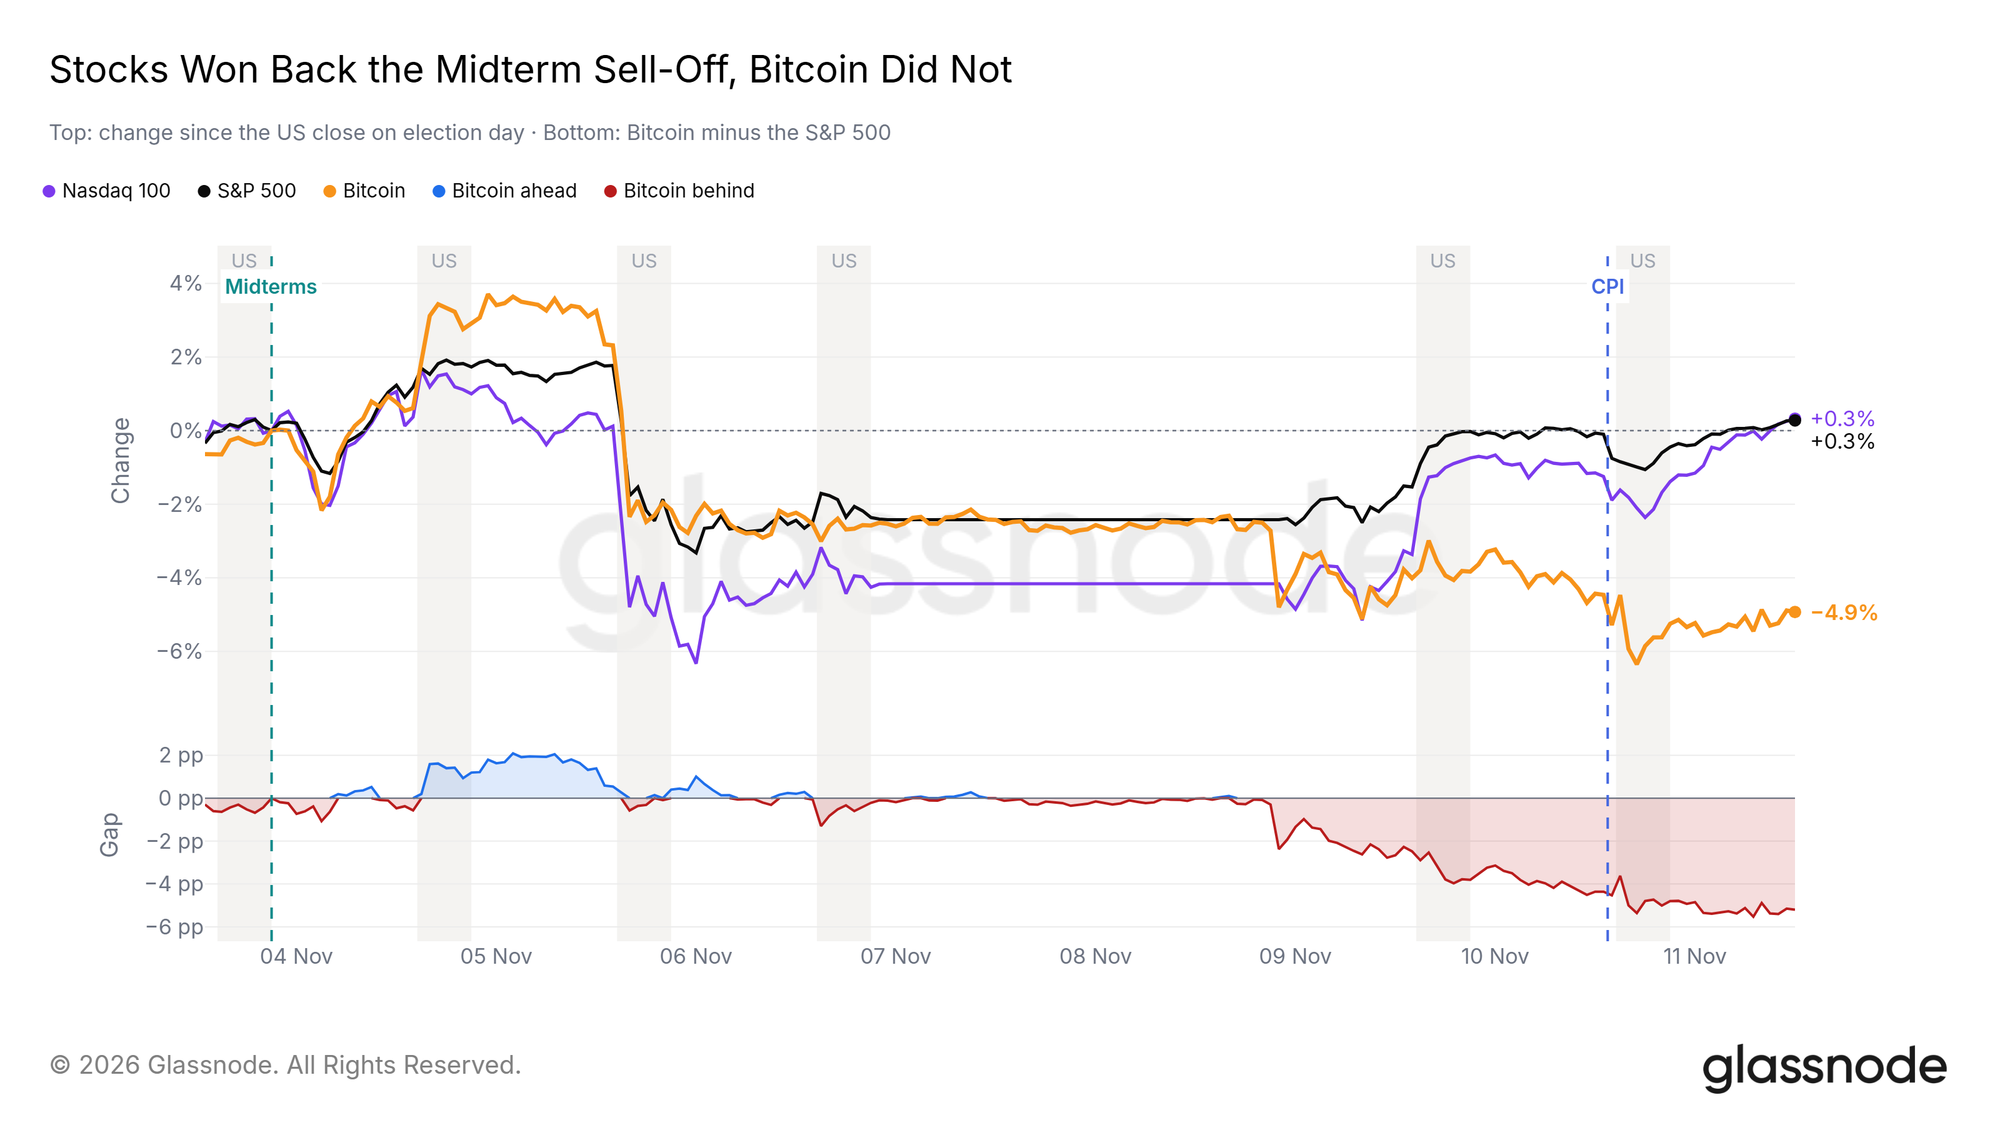
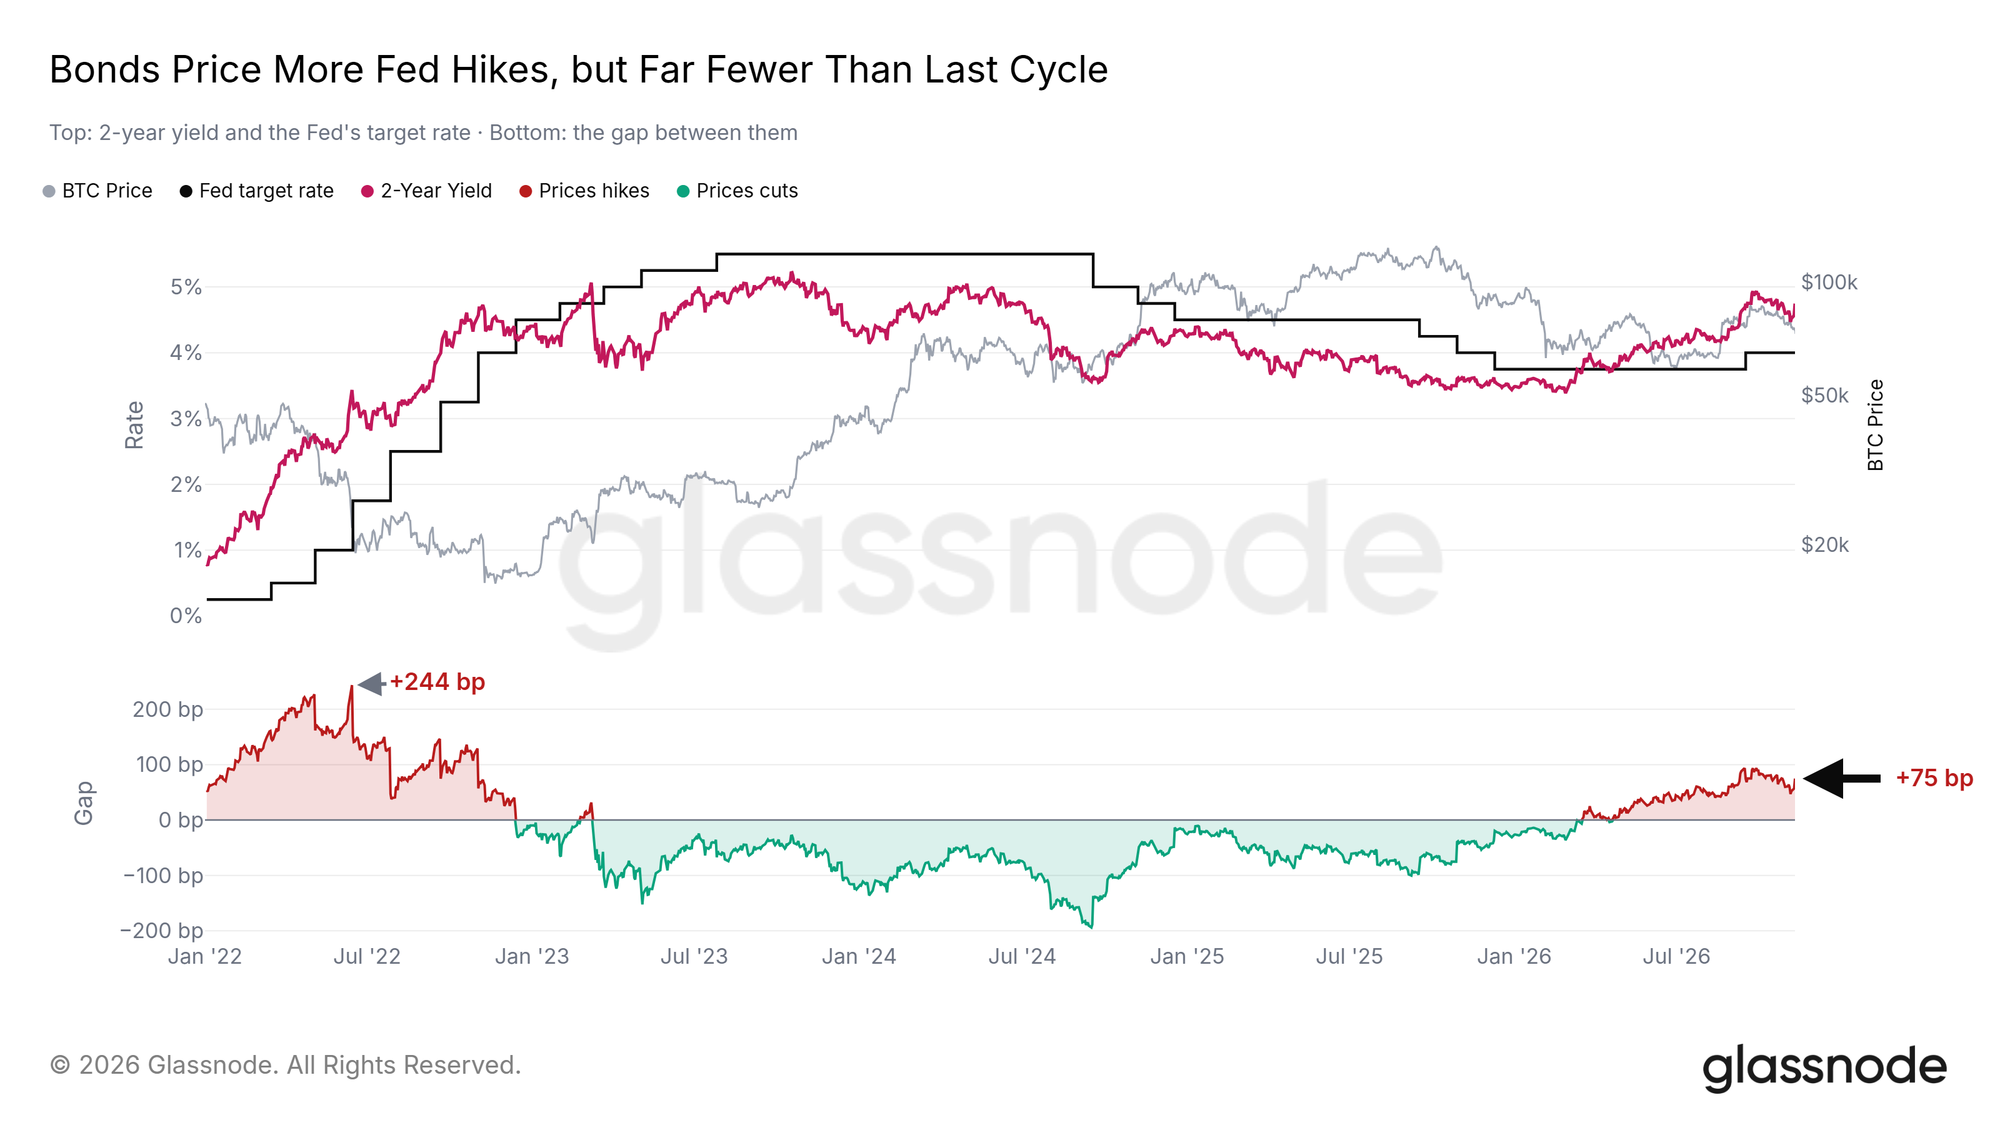
Bitcoin had also lagged US equities in the period examined. Glassnode reported that the S&P 500 and Nasdaq 100 had regained their election-day closing levels, whereas bitcoin remained about 5% below its $77,800 election-day close after falling again following the November 10 CPI release. As a further macro headwind, the report put the two-year US Treasury yield at 4.75%, versus a 4% Federal Reserve policy rate. Its 75-basis-point spread was well below the 244-basis-point spread Glassnode cited for June 2022 and had narrowed since late October.
Less nearby long leverage, but limited evidence of broad accumulation
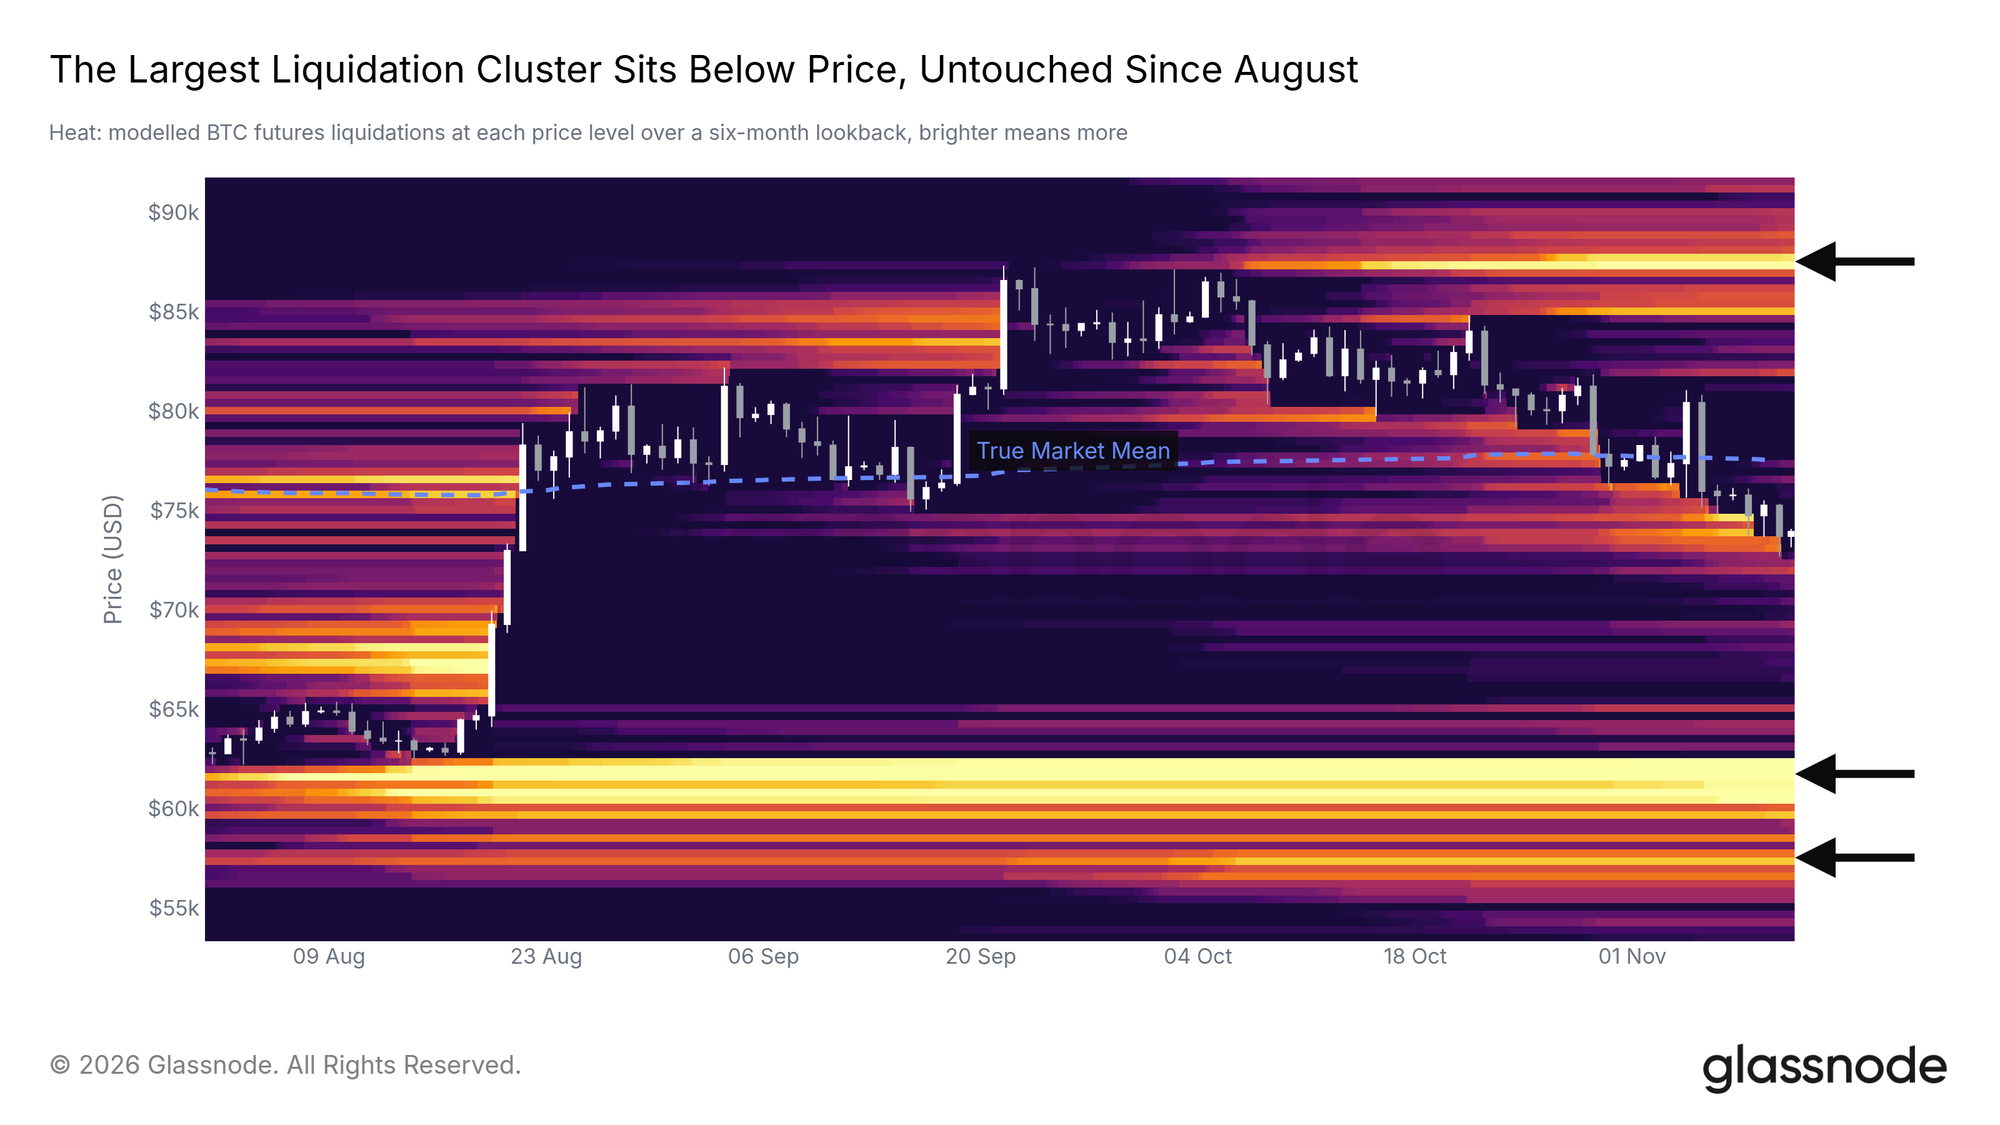
Glassnode’s liquidation heatmap showed much of the previously accumulated long-liquidation exposure near spot had been cleared during the decline from September. On its six-month view, the largest remaining concentration below price lay at $59,500–$62,600; it identified a short-liquidation concentration near $87,500. Open interest had nevertheless returned to its September-peak level despite an approximately 15% price decline. Glassnode suggested that traders may have added short positions during the fall, but open interest by itself cannot establish their direction.
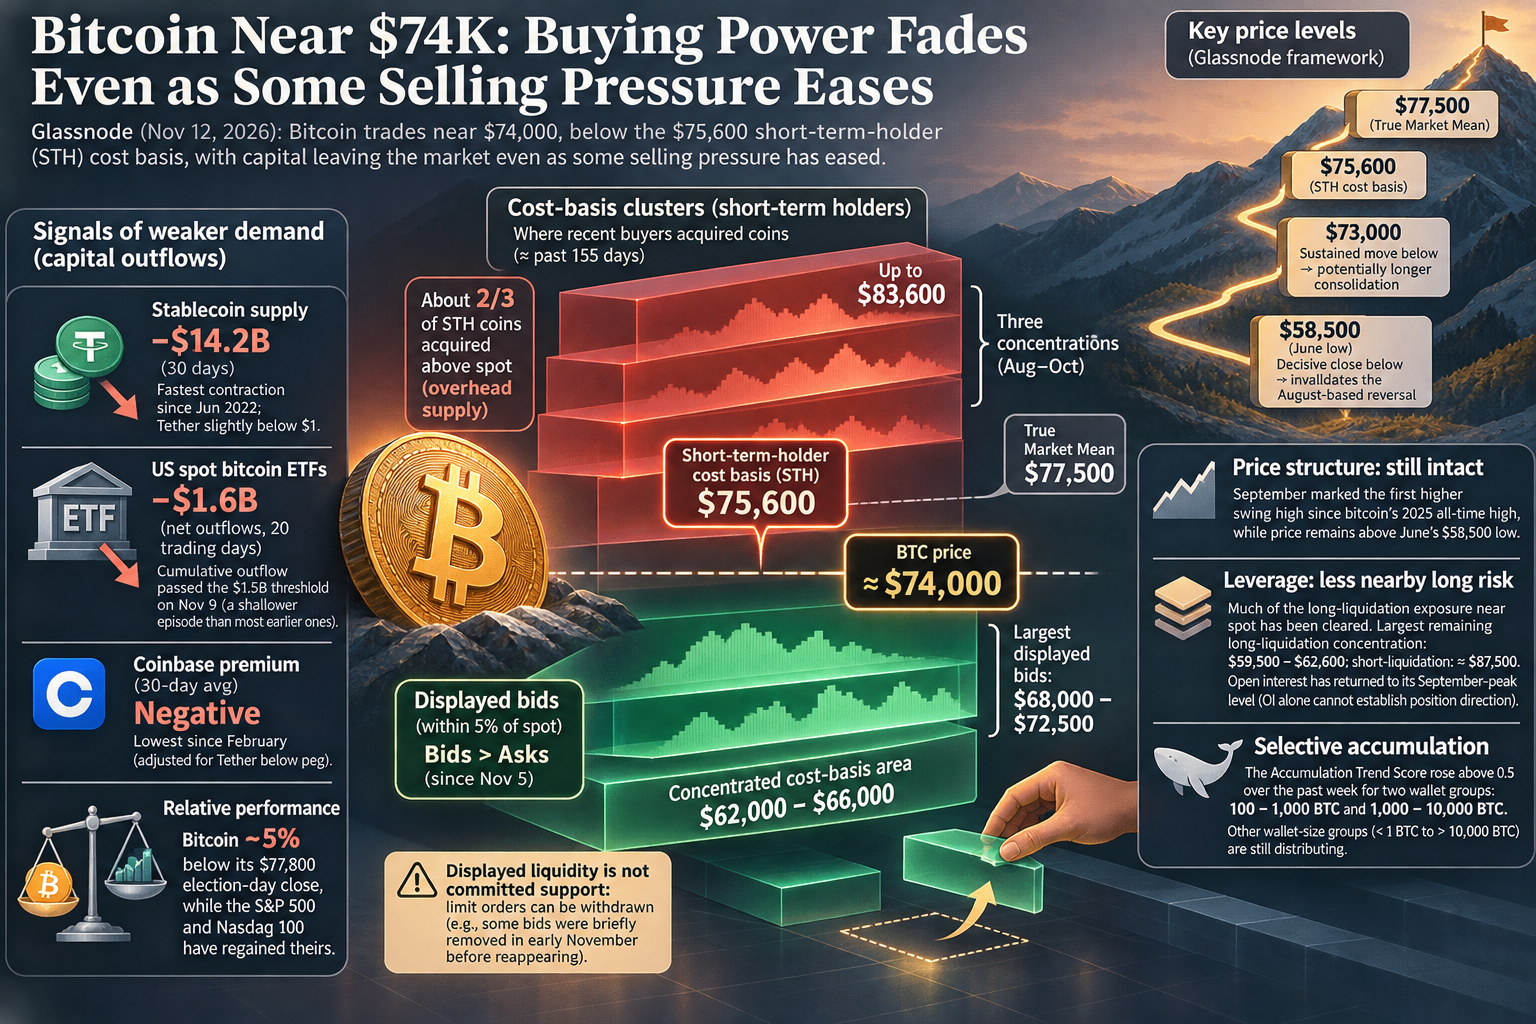
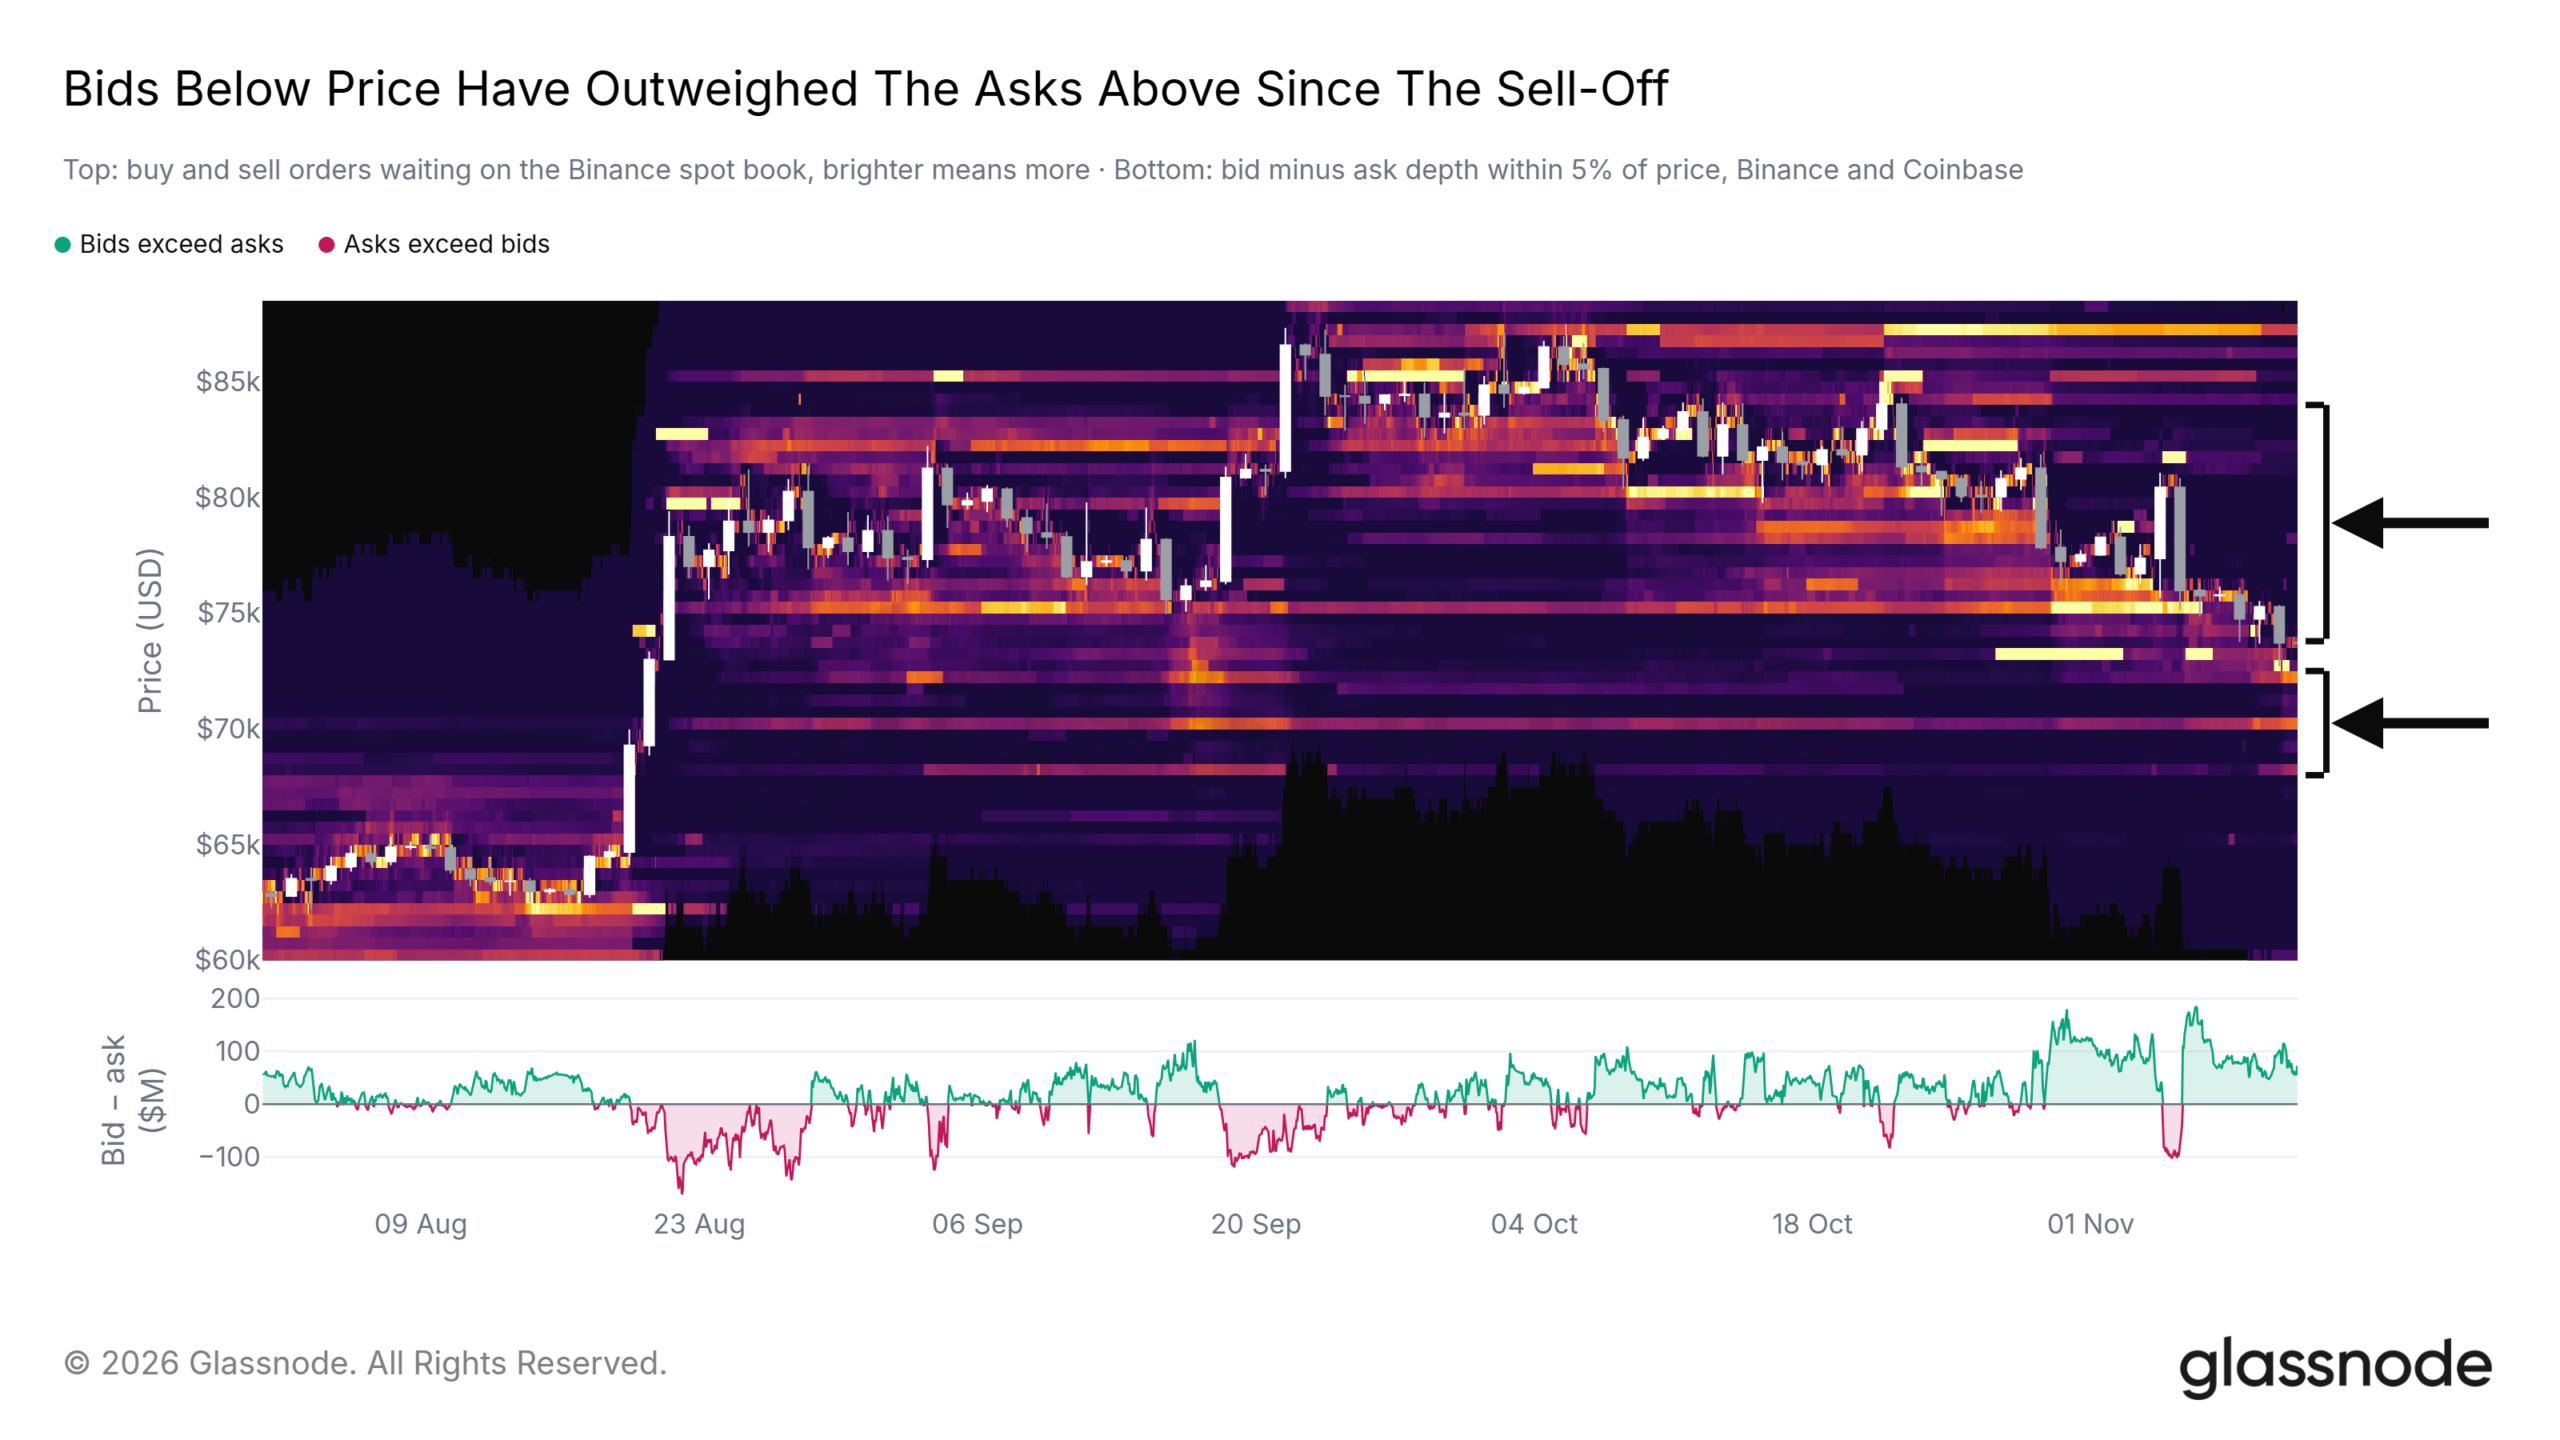
On Binance and Coinbase, displayed bids within 5% of spot exceeded asks in every hourly interval since the November 5 sell-off, according to the report. The largest bid concentrations were at $68,000–$72,500, while displayed asks were relatively sparse above the nearest sell orders through roughly $84,000. Displayed liquidity is not committed support: Glassnode noted that some bids were briefly withdrawn during the early-November decline before reappearing.

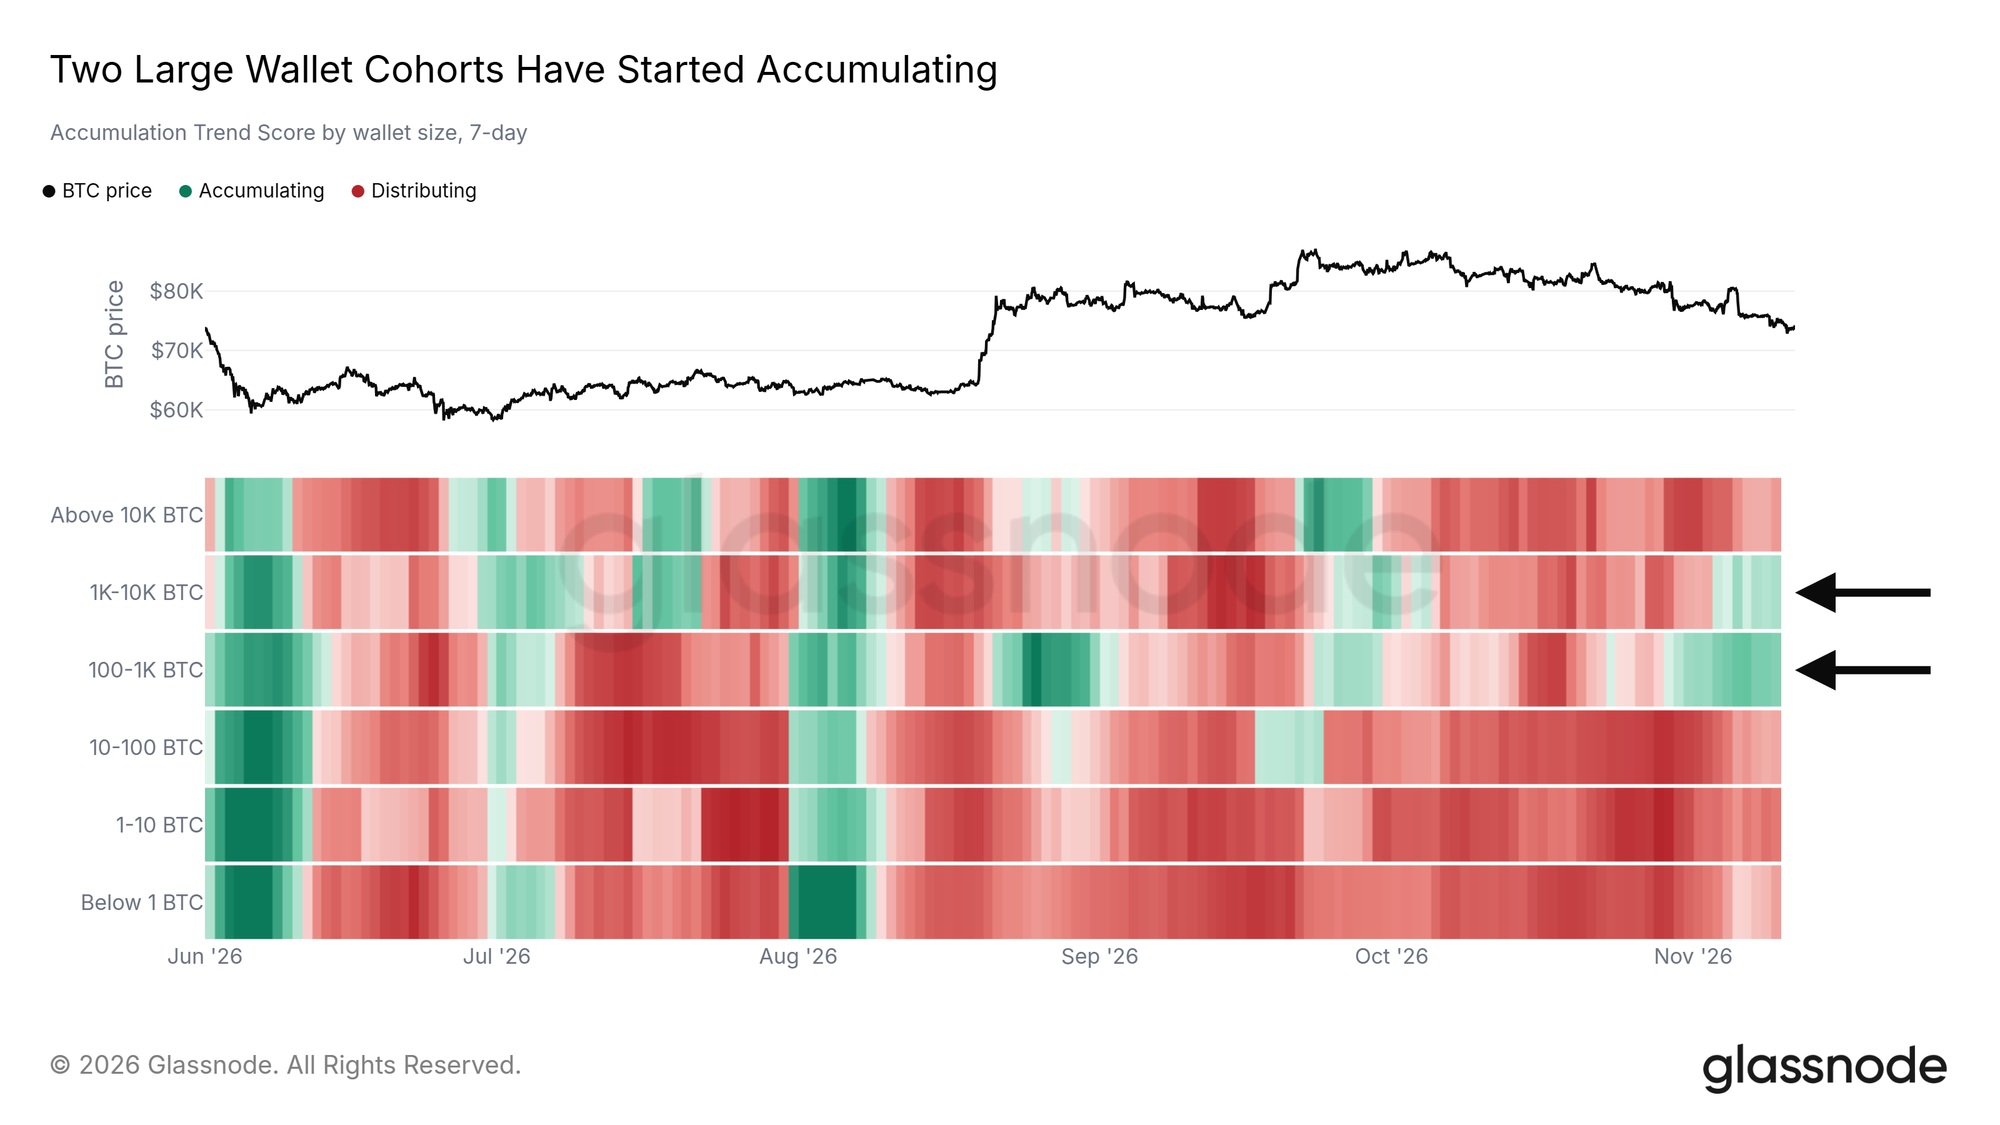
Finally, Glassnode’s holding-size-weighted Accumulation Trend Score rose above 0.5 over the preceding week for two wallet groups: those holding 100–1,000 BTC and 1,000–10,000 BTC. Both had mostly been distributing in October. Other wallet-size groups, from below 1 BTC to above 10,000 BTC, were still distributing, and the two larger groups’ brief turn toward buying in late September had not persisted. The evidence points to selective accumulation, not a market-wide shift.