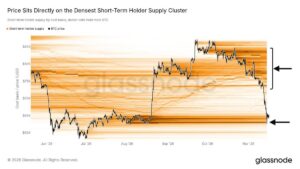
In a report published on November 21, 2026, BlockBeats cited Coinglass liquidation-map data for major centralized exchanges. The map showed cumulative long-liquidation intensity of 180 million if Bitcoin fell below $57,000, compared with cumulative short-liquidation intensity of 320 million if it rose above $60,000.
These figures are not exact estimates of contracts awaiting liquidation or their dollar value. BlockBeats explained that liquidation-map bars indicate the relative intensity of each liquidation cluster compared with nearby clusters. A taller bar suggests a potentially stronger liquidity-driven reaction if the price reaches that level; it does not establish how much will actually be liquidated.