
In a report published on October 29, 2026, Glassnode described a Bitcoin market caught between weakening demand and limited realized selling pressure. Its analysis was primarily a snapshot through October 27, not a reading of subsequent price action. The report treated the October 28 Federal Reserve decision as an upcoming event; it did not provide the decision’s outcome.
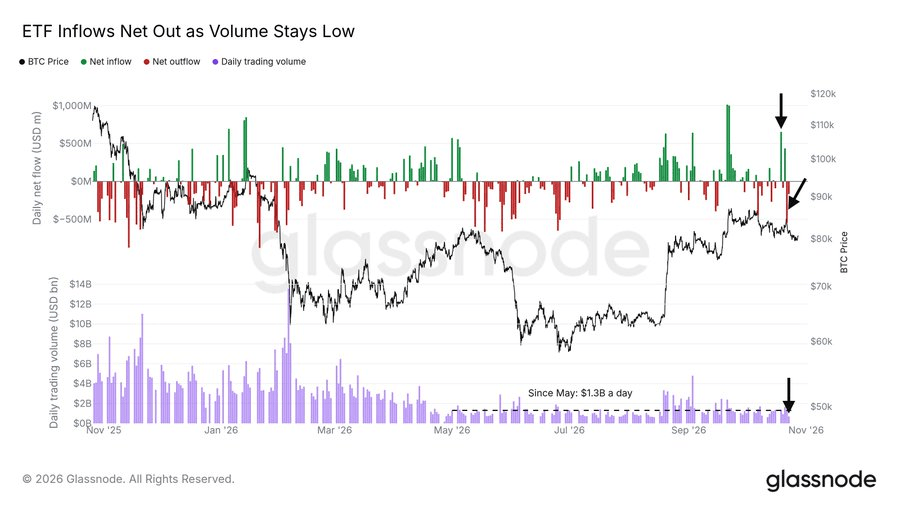
ETF flows and holder cost bases
Glassnode reported a $653 million inflow into US spot Bitcoin ETFs on October 19, followed by substantial outflows, including $540 million on October 22. Net inflows over the preceding two weeks were just $67 million. Average daily ETF trading volume had been about $1.3 billion since early May, falling to roughly $700 million on October 23. Together, those measures offered little evidence of renewed ETF demand at the prices covered by the report.
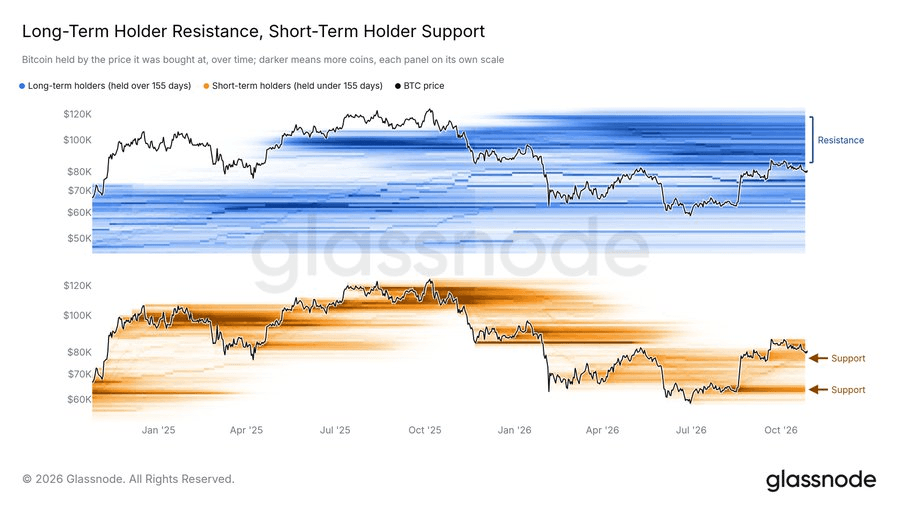
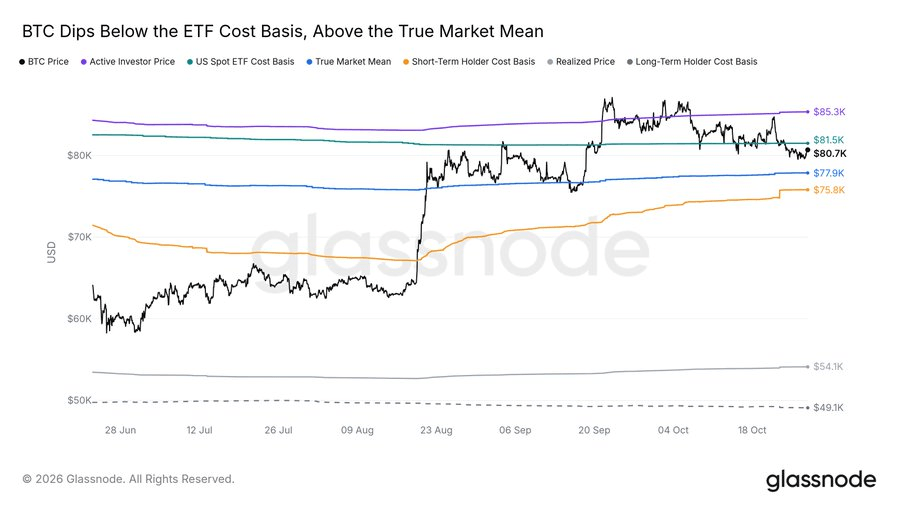
The report placed the ETFs’ average cost basis at $81,500, slightly above Bitcoin’s price at the time. It estimated the True Market Mean, a cost-basis measure for active investors, at $77,900 and the short-term holder cost basis at $75,800.
Glassnode’s cost-basis distribution put approximately 4 million BTC held by long-term holders—coins held for more than 155 days—in the $85,000–$118,000 range. More than half of those coins had a cost basis above the prevailing price. That creates a possible source of selling on a rebound, not proof that holders will sell. Short-term holders’ largest cost-basis cluster was near $77,000, with another near $64,000.
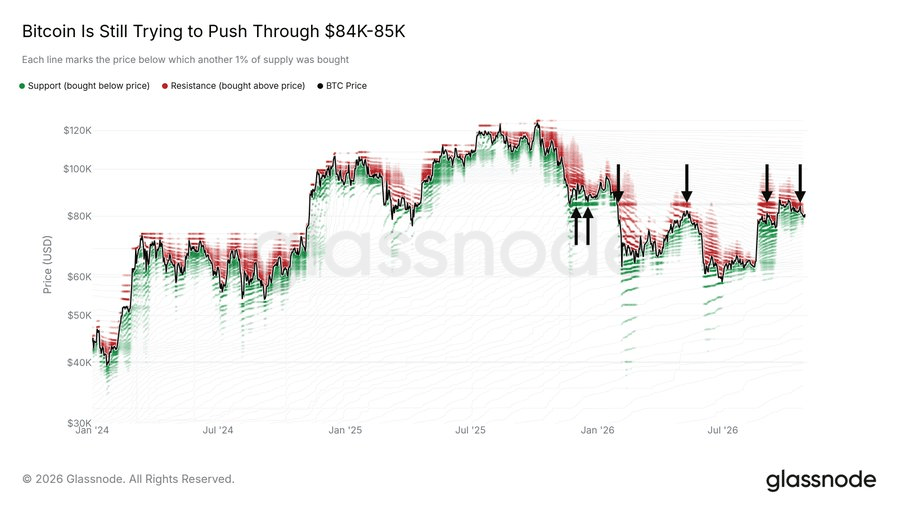
Why the $84,000–$85,000 zone needs care
Glassnode said roughly 4.3% of Bitcoin supply last moved on-chain between $84,000 and $85,000. Most of that movement occurred on November 22, 2025, when a single large entity transferred coins between its own wallets. Last-moved price is therefore not necessarily an acquisition price or evidence of a market purchase.
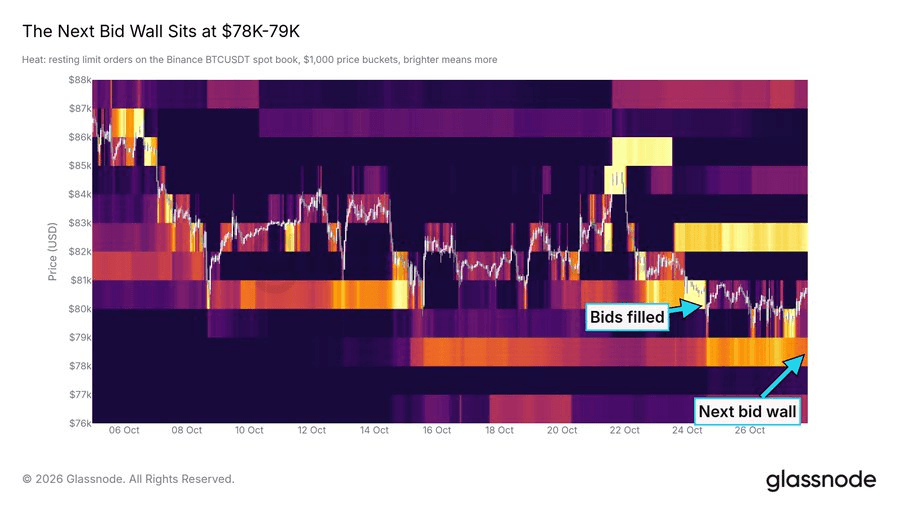
The report nevertheless identified the range as a recurring price barrier: it described support there in December, a break below it in January, and resistance during subsequent rebounds. It counted only five daily closes above the zone since January, with no run lasting more than three days. On Binance’s spot order book, meanwhile, Glassnode observed about $42 million in bids at $78,000–$79,000, versus approximately $3.4 million remaining at $80,000 after an October 24 price dip. Posted orders can change or be withdrawn, so the bid concentration is not guaranteed support.
Separating transfers from selling
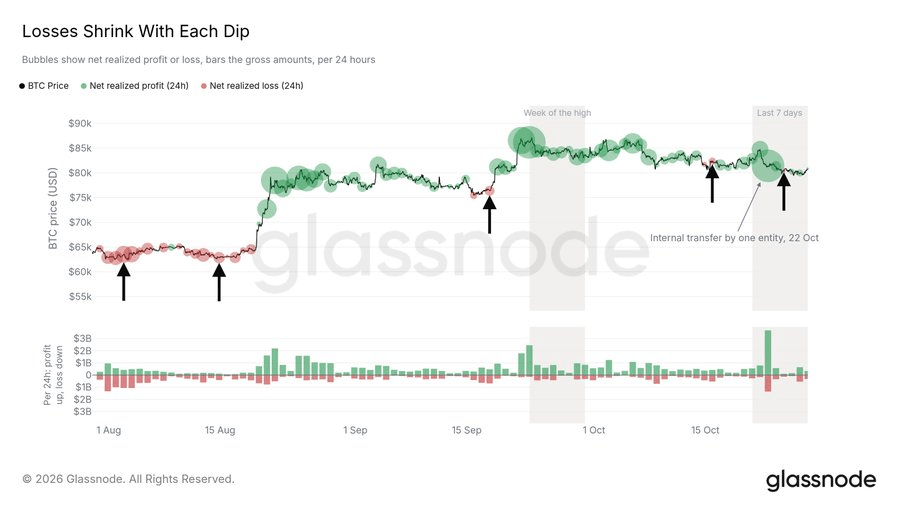
Glassnode reported that the largest daily net realized loss during an August low was about $630 million, compared with approximately $27 million during the October 24 dip. That comparison suggests less loss-taking on the later decline, but one unusually large transfer shows why the measurement method matters.
According to Glassnode, an entity’s transfers between its own wallets on October 22 produced roughly $3.7 billion of realized profit and $1.4 billion of realized loss under standard on-chain accounting, without corresponding market sales. Its entity-adjusted measure put actual profit-taking pressure that week at about $260 million per day, roughly half the level during a September peak week. The report cautioned that recent daily data could be revised retrospectively.
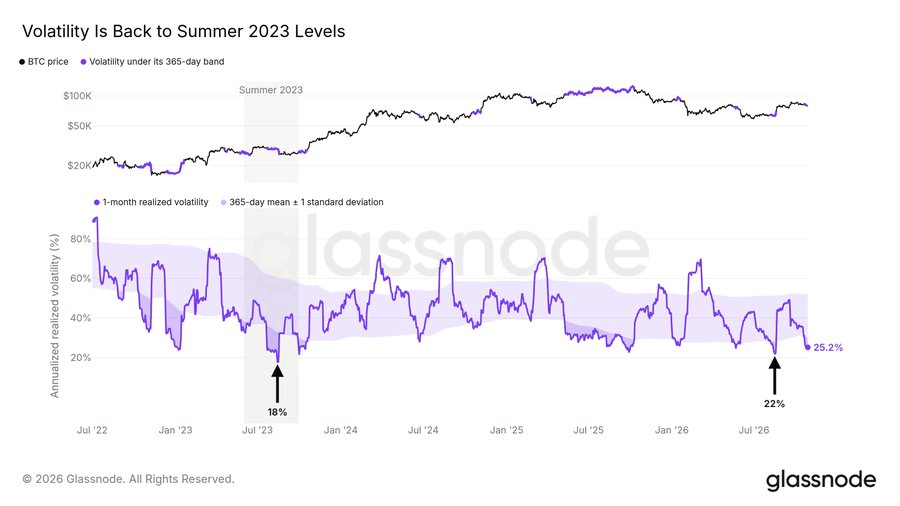
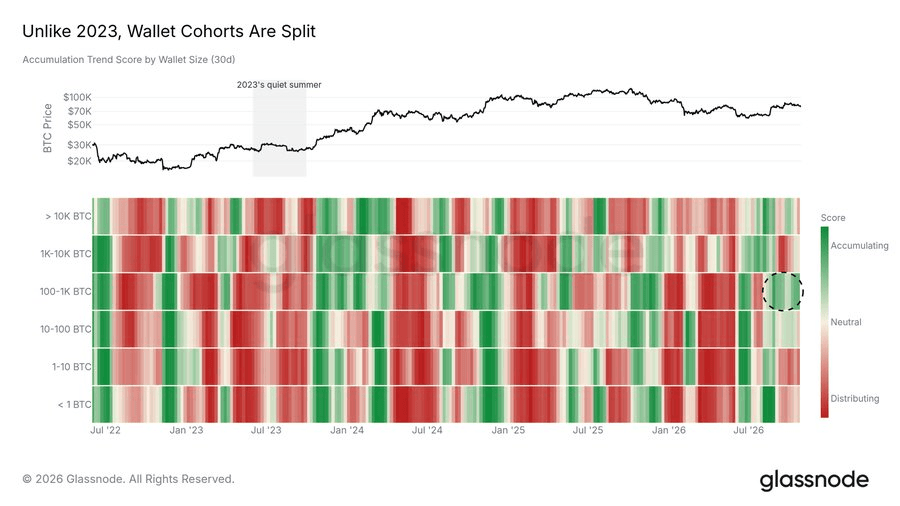
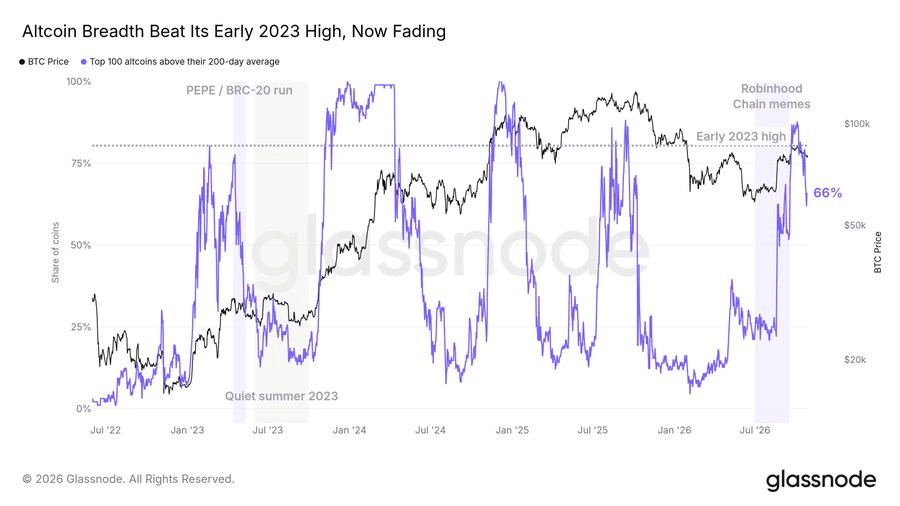
Other indicators were mixed. Glassnode’s Accumulation Trend Score showed wallets holding 100–1,000 BTC as the strongest buyers that month, while several other wallet-size groups had recently been net sellers. One-month realized volatility was around 25%; Glassnode estimated that Bitcoin had been calmer on only about 5% of trading days since 2015. Among the 100 largest altcoins, the share trading above their 200-day moving average had fallen from 88% on October 4 to 66%; the corresponding share among the top 500 was 42%.
The evidence supports a narrow conclusion: at Glassnode’s measurement dates, ETF flows and participation offered limited confirmation of stronger demand, while entity-adjusted on-chain data showed relatively restrained selling. Neither cost-basis levels nor order-book bids establish where price must move next.
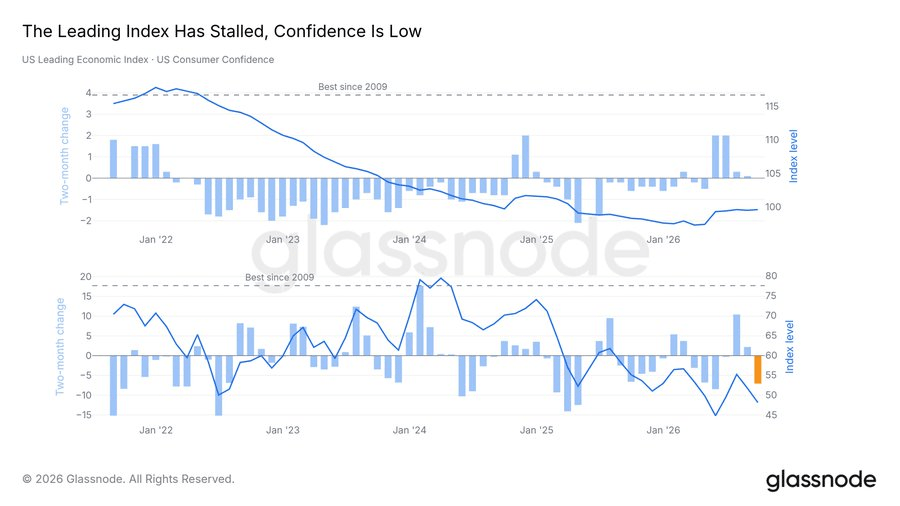
Data timing: Glassnode stated that price, order-book and hourly on-chain data ran through October 27, 2026; some full-day on-chain indicators, ETF flows and Hyperliquid data ran through October 25 or 26. The macroeconomic figures discussed in its report reflected September readings.